Question
Forecast the income statement and balance sheet using the information found in the case and the baseline assumptions below. Baseline assumptions Use a 3-year average
Forecast the income statement and balance sheet using the information found in the case and the baseline assumptions below.
Baseline assumptions Use a 3-year average for forecasting items without specific case information ? Hold cash at $4,180 ? Forecast interest expense using the rate on the debt and the end of year debt value ? Unit sales increase to 2.2 million cubic yards and prices are raised by 7% ? Cost per yard increases by 9% ? CAPEX of $16 million ? Dividend payment of $3 million
Questions to answer with the model: 1) What is the external financing needed under the assumptions above? 2) What is the external financing needed if unit volume remains flat and prices are raised by 4%? 3) How much cash would be on the balance sheet at the end of 2024 if the dividend is not paid under the baseline assumptions (i.e. treat cash as the plug variable and set the dividend = 0)? ? Remember to change your model back to the units and prices from the baseline assumption. 4) What amount of debt is needed under the baseline assumptions above to make the balance sheet "balance" (i.e. treat debt as the plug variable)? 5) What is the EBITDA for the firm in 2023? 6) What is the maximum debt capacity of the firm based on 3x the 2023 EBITDA? 7) Would the firm able to increase their debt outstanding to meet the cash needs of the firm based on #4 & #6 above? I.E. is the debt amount from #4 lower than the debt capacity in #6

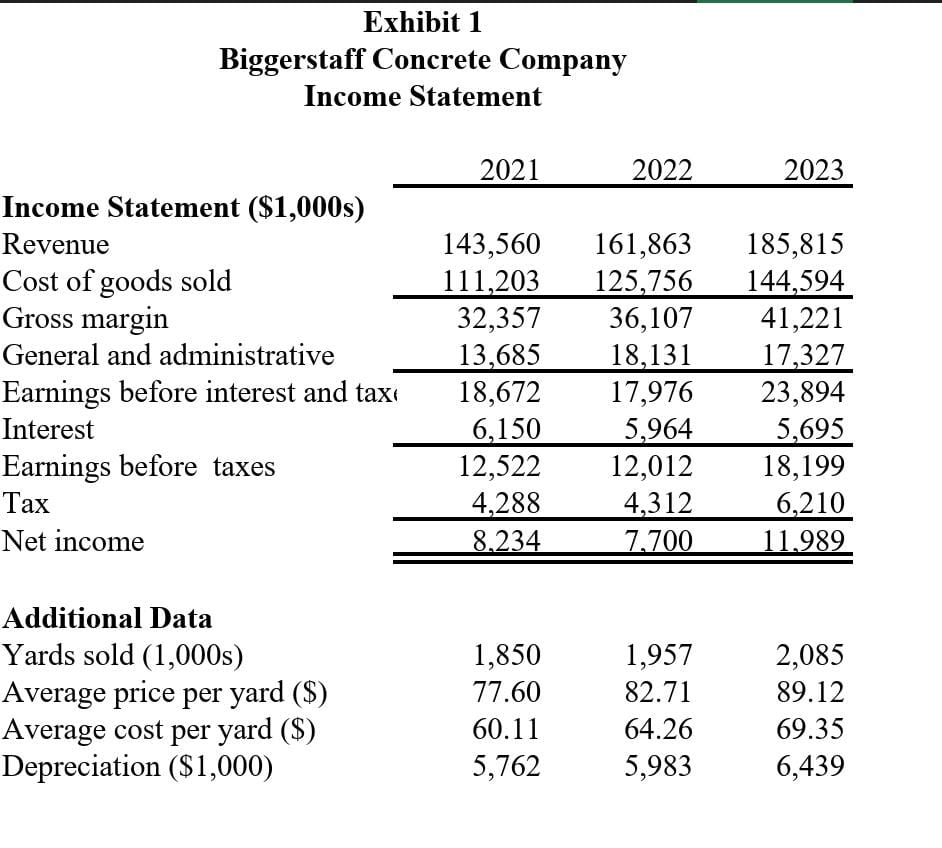
Exhibit 1 Biggerstaff Concrete Company Income Statement 2021 2022 2023 Income Statement ($1,000s) Revenue 143,560 161,863 185,815 Cost of goods sold 111,203 125,756 144,594 Gross margin 32,357 36,107 41,221 General and administrative 13,685 18,131 17,327 Earnings before interest and tax 18,672 17,976 23,894 Interest 6,150 5,964 5,695 Earnings before taxes 12,522 12,012 18,199 Tax 4,288 4,312 6,210 Net income 8.234 7,700 11.989 Additional Data Yards sold (1,000s) 1,850 1,957 2,085 Average price per yard ($) 77.60 82.71 89.12 Average cost per yard ($) 60.11 64.26 69.35 Depreciation ($1,000) 5,762 5,983 6,439
Step by Step Solution
There are 3 Steps involved in it
Step: 1

Get Instant Access to Expert-Tailored Solutions
See step-by-step solutions with expert insights and AI powered tools for academic success
Step: 2

Step: 3

Ace Your Homework with AI
Get the answers you need in no time with our AI-driven, step-by-step assistance
Get Started


