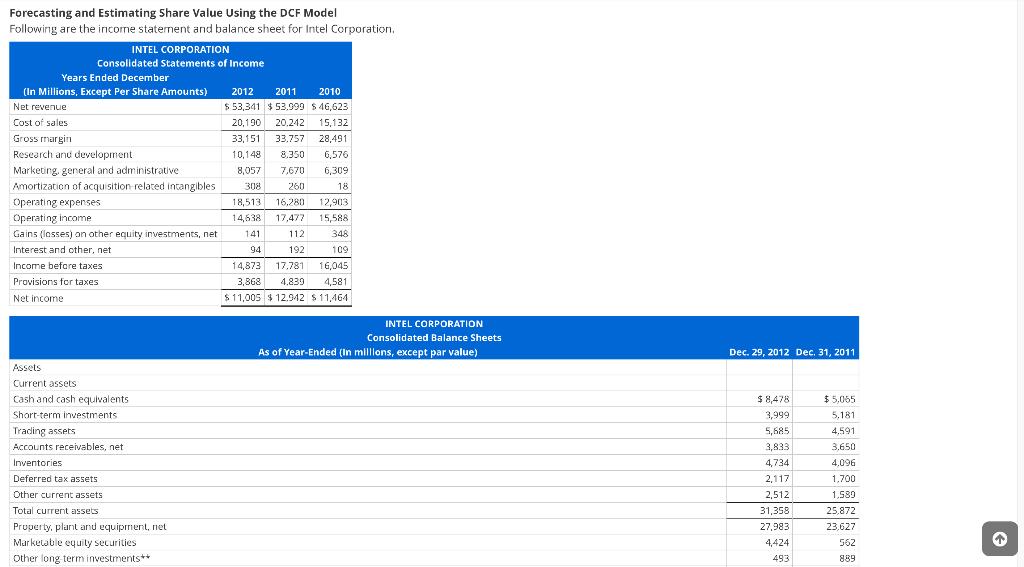
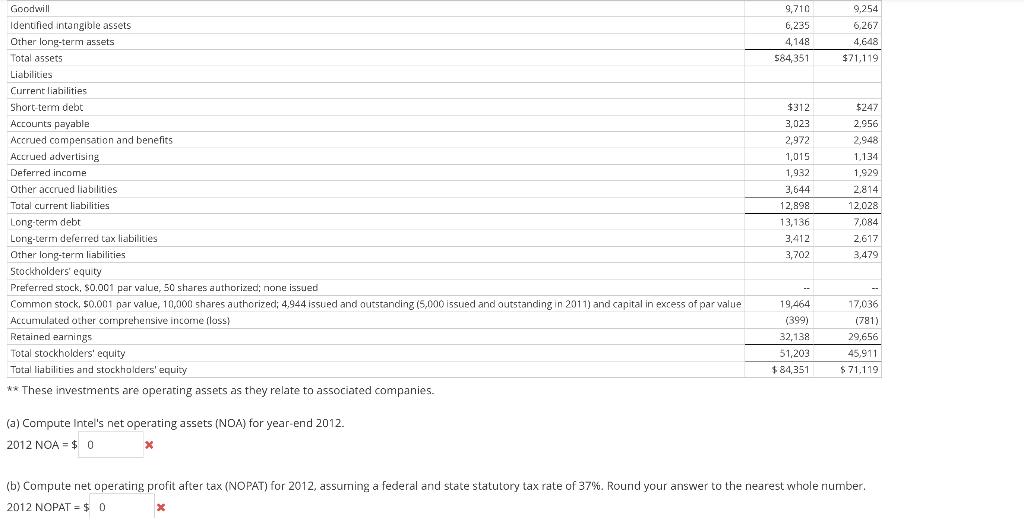
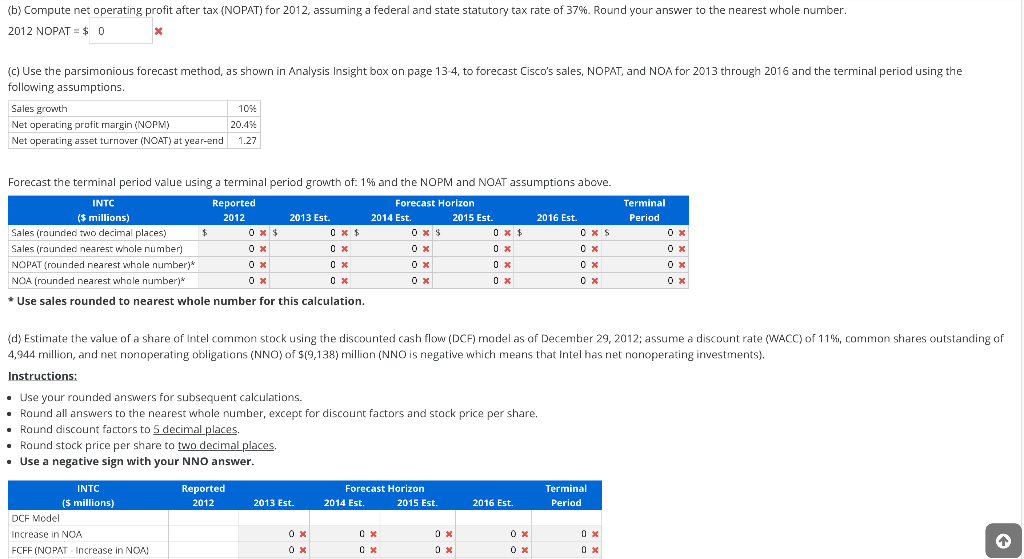
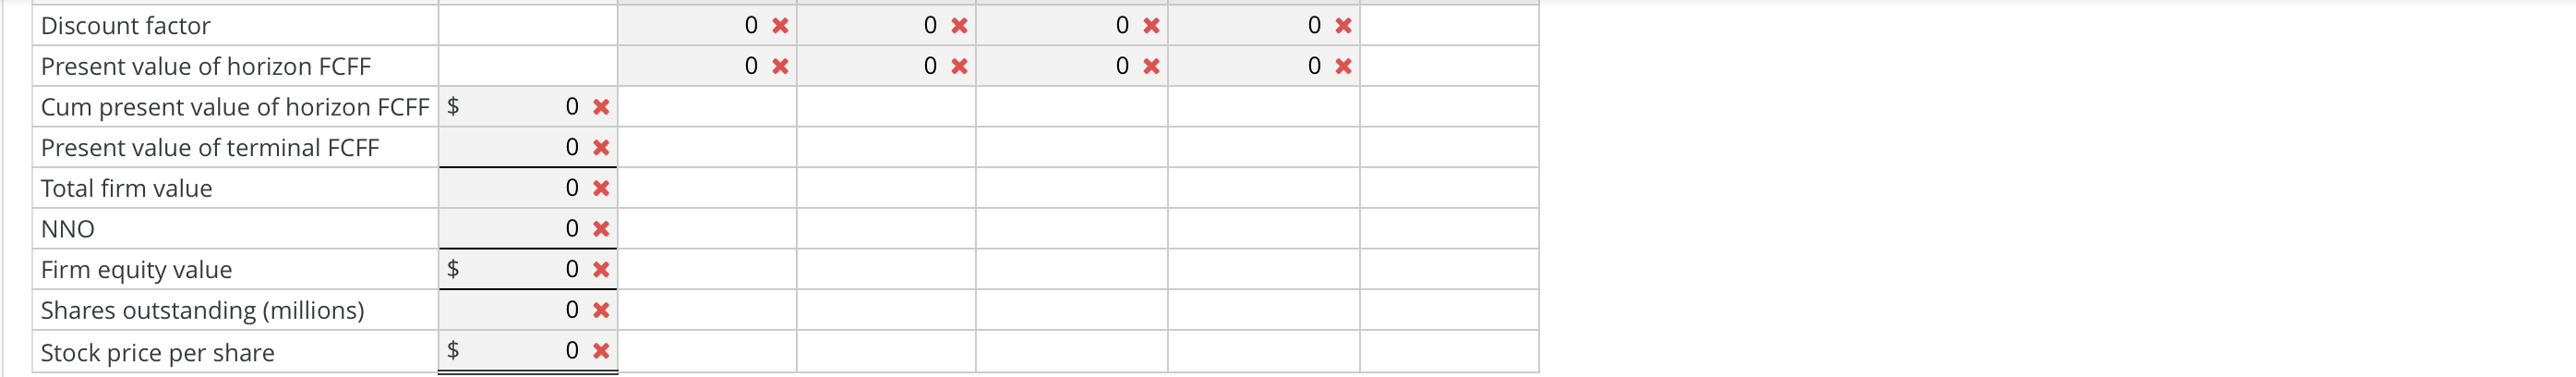
Forecasting and Estimating Share Value Using the DCF Model Following are the income statement and balance sheet for Intel Corporation. INTEL CORPORATION Consolidated Statements of Income Years Ended December (In Millions, Except Per Share Amounts) 2012 2011 2010 Net revenue $ 53,341 $53.999 $ 46,623 Cost of sales 20,190 20.242 15,132 Gross margin 33,151 33.757 28,491 Research and development 10,148 8.350 6,576 2016 Marketing general and administrative 7.670 6,309 Amortization of acquisition-related intangibles 308 250 18 . Operating expenses 1699 12 ans 18,513 16,280 12,903 nesti Operating income ca 16 EN 14,638 17,477 Gains classes) on other equity investments, net 141 112 348 0 Interest and other, net 94 192 109 Income before taxes 14,873 17.781 16,045 Provisions for taxes 3,868 4.829 4,581 Net income $ 11,005 $12.942 $ 11,464 8,057 INTEL CORPORATION Consolidated Balance Sheets As of Year-Ended (In millions, except par value) Dec. 29, 2012 Dec 31, 2011 Assets Current assets Cash and cash equivalents Short-term investments Trading assets Accounts receivables, net Inventories Deferred tax assets . Other current assets Total current assets Property, plant and equipment, net Marketable equity Securities Other long term investments** $ 8,478 3,999 5,685 3,833 Wide 4734 2442 2.117 2,512 31,358 4 CD 27,983 4,424 493 $5,065 5,181 4,591 3,650 62 4,096 1.700 1.589 25.872 23,627 562 889 9,254 9,710 6,235 4,148 584,351 6,267 4.648 $71,119 $247 2.956 2.948 1.134 1.929 Goodwill Identified intangible assets Other long-term assets To start Total assets Liabilities Current liabilities Short-term debt Accounts payable Accrued compensation and benefits Accrued advertising Deferred income . Other accrued liabilities Total current liabilities Long-term debt Long-term deferred tax liabilities Other long-term liabilities - Stockholders' equity Preferred stock, S0.001 par value, 50 shares authorized: none issued Common stock, 50.001 par value, 10,000 shares authorized; 4,944 issued and outstanding (5,000 issued and outstanding in 2011) and capital in excess of par value Accumulated other comprehensive income (loss) Retained earnings Total stockholders' equity Total liabilities and stockholders' equity ** These investments are operating assets as they relate to associated companies. $312 3,023 2,972 1,015 1,932 3,644 12,898 13,136 3,412 3,702 2.814 12.028 7,084 2.617 3,479 19,464 (399) 32,138 51,203 $ 84,351 17,036 (781) 29,656 45,911 $71.119 (a) Compute Intel's net operating assets (NOA) for year-end 2012. 2012 NOA = $ 0 X (b) Compute net operating profit after tax (NOPAT) for 2012, assuming a federal and state statutory tax rate of 37%. Round your answer to the nearest whole number. 2012 NOPAT = $ 0 (b) Compute net operating profit after tax (NOPAT) for 2012, assuming a federal and state statutory tax rate of 37%. Round your answer to the nearest whole number. 2012 NOPAT = $ 0 X (c) Use the parsimonious forecast method, as shown in Analysis Insight box on page 13-4, to forecast Cisco's sales, NOPAT, and NOA for 2013 through 2016 and the terminal period using the following assumptions. Sales growth 1054 Net operating profit margin (NOPM) 20.4% Net operating asset turnover (NOAT) at year-end 1.27 Reported Terminal Period Forecast the terminal period value using a terminal period growth of: 19 and the NOPM and NOAT assumptions above. INTC Forecast Horizon ($ millions) 2012 2013 Est. 2014 Est. 2015 Est. 2016 Est. Sales (rounded two decimal places) $ 0X $ 0X $ 0 X 5 Sales (rounded nearest whole number) OX NOPAT (rounded nearest whole number) 0 x NOA (rounded nearest whole number)* 0x OX * Use sales rounded to nearest whole number for this calculation. OX OX (d) Estimate the value of a share of Intel common stock using the discounted cash flow (DCF) model as of December 29, 2012; assume a discount rate (WACC) of 11%, common shares outstanding of 4,944 million, and net nonoperating obligations (NNO) of $(9,138) million (NNO is negative which means that Intel has net nonoperating investments). Instructions: Use your rounded answers for subsequent calculations. Round all answers to the nearest whole number, except for discount factors and stock price per share, Round discount factors to 5 decimal places Round stock price per share to two decimal places, Use a negative sign with your NNO answer. Reported 2012 Forecast Horizon 2014 Est. 2015 Est. Terminal Period 2013 Est. 2016 Est. INTC (5 millions) DCF Model Increase in NOA FCFF (NOPAT Increase in NOA 0 X OX OX OX OX Discount factor 0 X 0 x 0 x 0 x Present value of horizon FCFF 0 x 0 x 0 x 0 x 0 x Cum present value of horizon FCFF $ Present value of terminal FCFF Total firm value 0 x 0 x NNO OX $ 0 x Firm equity value Shares outstanding (millions) Stock price per share 0 x $ 0 X