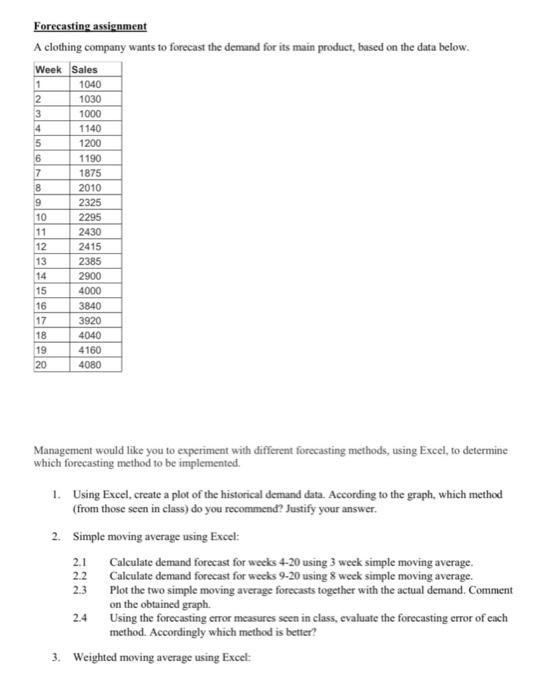
Forecasting assignment A clothing company wants to forecast the demand for its main product, based on the data below. Week Sales 1 1040 2 1030 3 1000 4 1140 5 1200 6 1190 7 1875 8 2010 9 2325 10 2295 11 2430 12 2415 13 2385 14 2900 15 4000 16 3840 17 3920 18 4040 19 4160 20 4080 Management would like you to experiment with different forecasting methods, using Excel, to determine which forecasting method to be implemented. 1. Using Excel, create a plot of the historical demand data. According to the graph, which method (from those seen in class) do you recommend? Justify your answer. 2. Simple moving average using Excel 2.1 Calculate demand forecast for weeks 4-20 using 3 week simple moving average. Calculate demand forecast for weeks 9-20 using 8 week simple moving average. 2.3 Plot the two simple moving average forecasts together with the actual demand. Comment on the obtained graph Using the forecasting error measures seen in class, evaluate the forecasting error of each method. Accordingly which method is better? 3. Weighted moving average using Excel: 2.2 2.4 3.1 3.2 Calculate demand forecast for weeks 6-20 using 5 week weighted moving average with weights 0.4, 0.2, 0.2, 0.1, 0.1 Calculate demand forecast for weeks 6-20 using 5 week weighted moving average with weights 0.2, 0.2, 0.2, 0.2, 0.2 Plot the two weighted moving average forecasts together with the actual demand. Comment on the obtained graph. Using the forecasting error measures seen in class, evaluate the forecasting error of each method. Accordingly which method is better? 3.3 3.4 4. Linear regression using Excel 4.1 Using data analysis toolpack, carry out linear regression for the demand data. Provide a detailed analysis of the regression output in the way we did in class. 4.2 Write the regression line equation. 4.3 Using the regression line equation, calculate in Excel demand forecast for weeks 1-20. 4.4 Plot linear regression forecast together with the actual demand and the forecasts selected in questions 2 and 3. Comment on the obtained graph. 4.5 Using the forecasting error measures seen in class, evaluate the forecasting error of linear regression. 4.6 Which forecasting method among those studied in questions 2, 3 and 4 is the best? Why? Forecasting assignment A clothing company wants to forecast the demand for its main product, based on the data below. Week Sales 1 1040 2 1030 3 1000 4 1140 5 1200 6 1190 7 1875 8 2010 9 2325 10 2295 11 2430 12 2415 13 2385 14 2900 15 4000 16 3840 17 3920 18 4040 19 4160 20 4080 Management would like you to experiment with different forecasting methods, using Excel, to determine which forecasting method to be implemented. 1. Using Excel, create a plot of the historical demand data. According to the graph, which method (from those seen in class) do you recommend? Justify your answer. 2. Simple moving average using Excel 2.1 Calculate demand forecast for weeks 4-20 using 3 week simple moving average. Calculate demand forecast for weeks 9-20 using 8 week simple moving average. 2.3 Plot the two simple moving average forecasts together with the actual demand. Comment on the obtained graph Using the forecasting error measures seen in class, evaluate the forecasting error of each method. Accordingly which method is better? 3. Weighted moving average using Excel: 2.2 2.4 3.1 3.2 Calculate demand forecast for weeks 6-20 using 5 week weighted moving average with weights 0.4, 0.2, 0.2, 0.1, 0.1 Calculate demand forecast for weeks 6-20 using 5 week weighted moving average with weights 0.2, 0.2, 0.2, 0.2, 0.2 Plot the two weighted moving average forecasts together with the actual demand. Comment on the obtained graph. Using the forecasting error measures seen in class, evaluate the forecasting error of each method. Accordingly which method is better? 3.3 3.4 4. Linear regression using Excel 4.1 Using data analysis toolpack, carry out linear regression for the demand data. Provide a detailed analysis of the regression output in the way we did in class. 4.2 Write the regression line equation. 4.3 Using the regression line equation, calculate in Excel demand forecast for weeks 1-20. 4.4 Plot linear regression forecast together with the actual demand and the forecasts selected in questions 2 and 3. Comment on the obtained graph. 4.5 Using the forecasting error measures seen in class, evaluate the forecasting error of linear regression. 4.6 Which forecasting method among those studied in questions 2, 3 and 4 is the best? Why


