Answered step by step
Verified Expert Solution
Question
1 Approved Answer
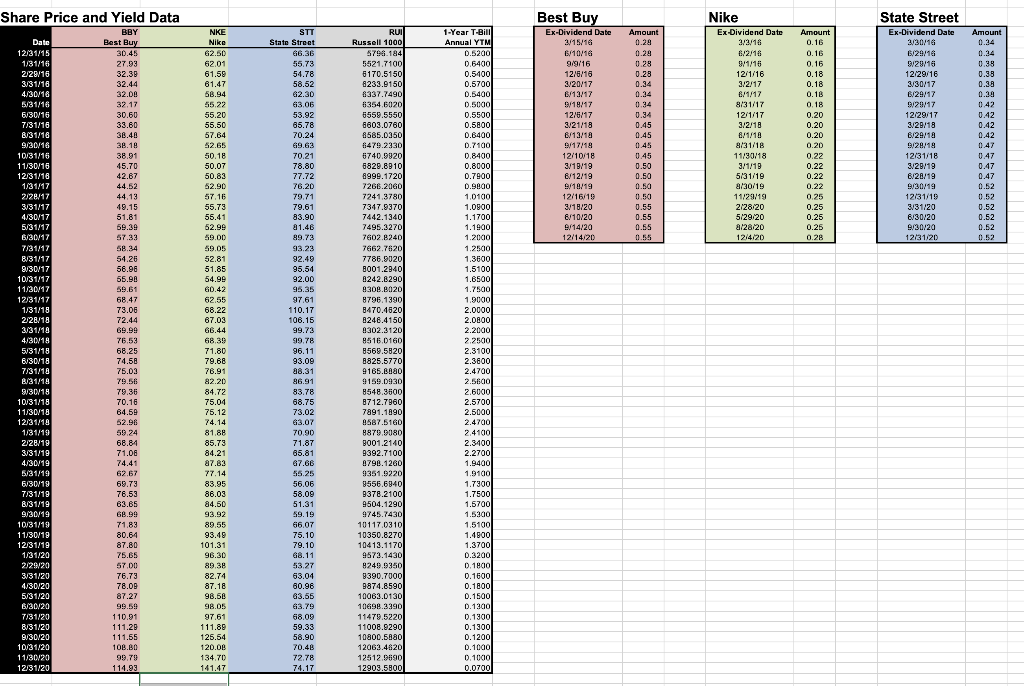
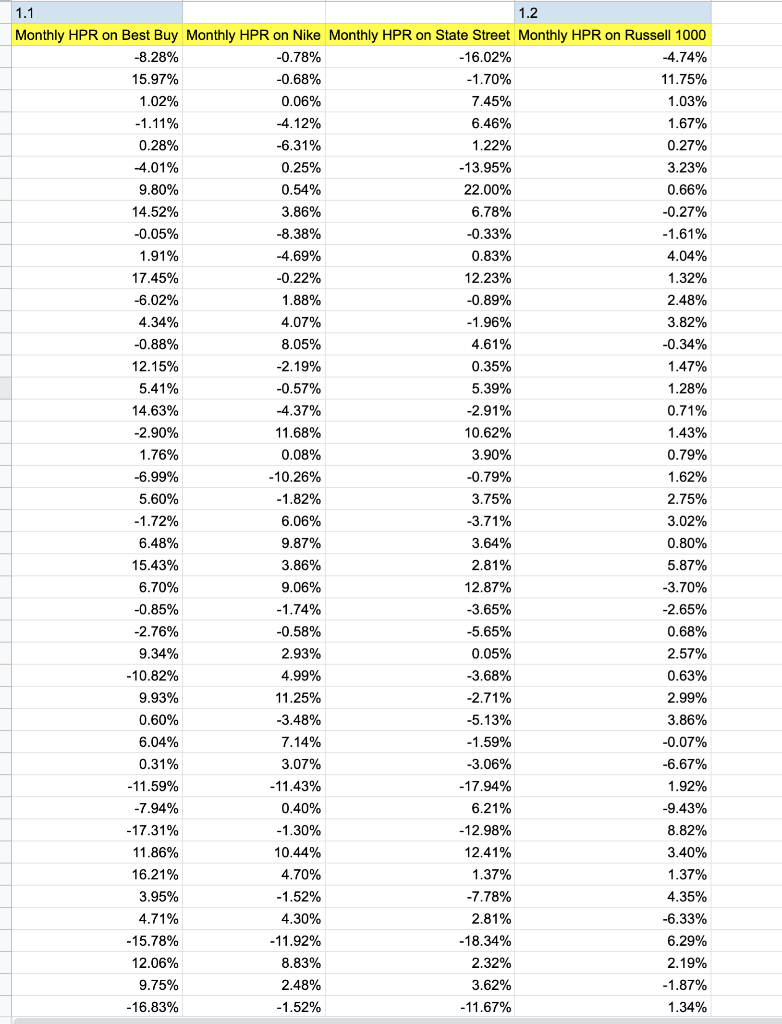
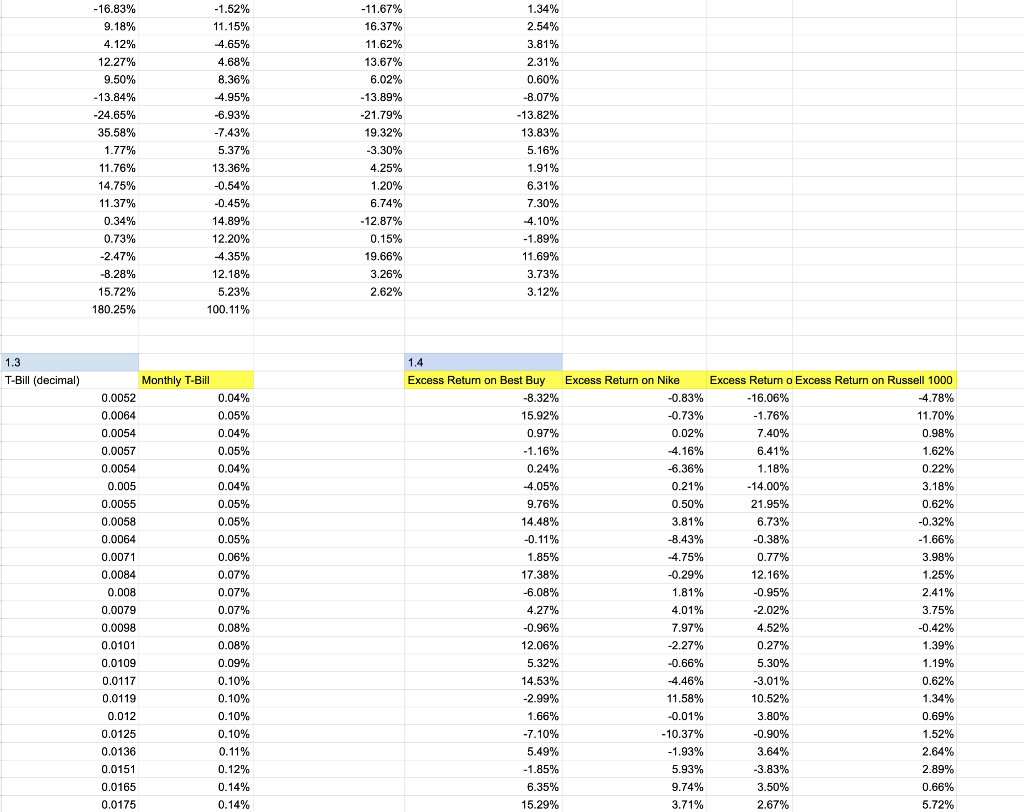
Form a correlation matrix and a variance-covariance matrix from the excess returns of the three stocks and the Russell 1000. Calculate betas for all three
Form a correlation matrix and a variance-covariance matrix from the excess returns of the three stocks and the Russell 1000.
Calculate betas for all three of the stocks in two ways: (i) using the entries from the variance-covariance matrix, and (ii) using theSLOPE()function.


Share Price and Yield Data Amount Amount 0.29 0.29 0.28 0.28 0.34 Best Buy Ex-Dividend Date 2/15/16 6/10/16 9/9/16 12/6/16 3/20/17 B/13/17 9/19/17 12/6/17 3/21/18 B/13/18 9/17/18 12/10/18 3/18/19 8/12/19 9/18/19 12/16/19 9/18/20 8/10/20 9/14/20 12/14/20 Nike Ex-Dividend Date 3/2/18 6/2/16 9/1/18 12/1/16 3/2/17 8/1/17 8/31/17 12/1/17 3/2/18 8/1/18 8/31/18 11/30/18 3/1/19 5/31/19 8/30/19 11/29/19 2/28/20 5/29/20 a/28/20 1214120 0.94 0.45 0.45 0.45 0.45 0.50 0.50 0.50 0.50 0.55 0.55 0.55 0.55 Amount 0.16 0.16 0.16 0.18 0.18 0.18 0.18 0.20 0.20 0.20 0.20 0.22 0.22 0.22 0.22 0.25 0.25 0.25 0.25 0.28 State Street Ex-Dividend Date 3/30/16 6/29/16 9/29/16 12/29/16 3/30/17 6/29/17 9/29/17 12/29/17 3/29/18 B/29/18 9/28/18 12/31/18 3/28/19 B/28/19 9/30/19 12/31/19 3/31/20 6/30/20 9/30/20 12/31/20 0.38 0.38 0.39 0.39 0.42 0.42 0.42 0.42 0.47 0.47 0.47 1.47 0.52 0.52 0.52 0.52 0.52 Date 12/31/15 1/31/16 2/28/16 3/31/16 4/30/16 5/31/16 6/30/16 7/31/18 B/31/18 9/30/16 10/31/16 11/30/16 12/31/16 1/31/17 2/28/17 3/31/17 4/30/17 6/31/17 6/30/17 7/31/17 8/31/17 9/30/17 10/31/17 11/30/17 12/31/17 1/31/18 2/28/18 3/31/18 4/30/18 5/31/18 6/30/18 7/31/18 B/31/18 9/30/18 10/31/18 11/30/18 12/31/18 1/31/19 2/28/19 3/31/19 4/30/19 5/31/19 BBY Best Buy 30.45 27.99 32.39 32.44 32.00 32.17 30.60 33.60 36.46 38.18 38.91 45.70 42.67 44.52 44.13 49.15 51.81 69.39 57.33 58.34 54.26 56.96 55.96 59.61 68.47 73.06 72.44 69.99 76.53 68.25 74.58 75.03 79.56 79.36 70.16 64.59 52.96 50 24 68.84 71.08 74.41 62.67 69.73 76.53 63.85 68.99 71.83 80.64 87.80 75.65 57.00 76.73 78.09 87.27 99.59 110.91 111.29 111.55 10B.BD 99.79 114.93 NKE Nike 62.50 62.01 61.59 61.47 58.94 55.22 55.20 55.50 67.84 52.65 50.18 50.07 50.83 52.90 57.16 55.73 55.41 52.99 59.00 59.05 52.81 51.85 54.99 60.42 62.55 68.22 67.03 66.44 68.39 71.80 79.68 76.91 82.20 84.72 75.04 75.12 74.14 81.88 85.73 84.21 87.83 77.14 83.95 86.03 84.50 93.92 89.55 93.49 101.31 96.30 89.38 82.74 87.18 98.56 98.05 97.61 111.89 125.64 120.00 134 70 141.47 STT State Street 66.36 55.73 54.78 58.52 62.30 63.06 53.92 65.78 70.24 69.63 70.21 78.80 77.72 76.20 79.71 79.61 83.90 81,46 89.73 93.23 92.49 95.54 92.00 95.35 97.61 110.17 106.15 99.73 99.78 96.11 93.09 88.31 86.91 83.78 68.75 73.02 63.07 70.90 71.87 65.81 67.66 55.25 56.06 58.09 51.31 59.19 66.07 75.10 79.10 68.11 53.27 63.04 60.96 63.55 63.79 68.09 59.33 58.90 70.48 72.78 74.17 RUI Russell 1000 5798.184 5521.7100 5170.51500 8233.2150 6337.7490 6354.6020 5559.5550 6603.0760 8585.0350 6479.2330 6740.9920 6829.8910 1999.1720 7266.2060 7241.3780 7347.9370 7442.1340 7495.3270 7602.8240 7662.7620 7786.9020 B001.2940 8242.8290 8308.8020 8796.1390 8470.4520 8248.4150 9302.3120 85160160 8569.5820 8825.57700 9165.BRDO 9159.0930 0548.3500 8712.7960 7891.1890 9587.5160 8879.9080 3001.2140 9392.7100 8796.1260 9351.9220 9556.6840 9378.2100 9504.1290 9745.7430 10117,0310 10350.8270 10413.1170 9573.1430 249.9350 9390.7000 9874.8590 10063.0130 10698.3390 11479.5220 11008.9290 10800.5880 12063.4820 12512.9590 12903 5800 1-Year T-Bill Annual YTM 0.5200 0.6400 FA 0.5400 0.5700 0.5400 0.5000 0.5500 0.5800 0.8400 0.7100 0.84001 0.8000 0.7900 0.9800 1.0100 1.0900 1.1700 1.1900 1.2000 1.2500 1.3600 1.5100 1.6500 1.7500 1.9000 2.0000 2.0800 2.2000 2.2500 2.3100 2.3600 2.4700 2.5600 2.6000 2.5700 2.5000 2.4700 2.4100 2.3400 2.2700 1.9400 1.9100 1.7300 1.7500 1.5700 1.5300 1.5100 1.4900 1.3700 0.3200 0.1800 0.1600 0.1800 0.15001 0.1300 0.1300 0.1300 0.1200 0.1000 0.1000 0.0700 6/30/19 7/31/19 8/31/19 9/30/19 10/31/19 11/30/19 12/31/19 1/31/20 2/29/20 3/31/20 4/30/20 5/31/20 6/30/20 7/31/20 8/31/20 8/30/20 10/31/20 11/30/20 12/31/20 1.1 1.2 Monthly HPR on Best Buy Monthly HPR on Nike Monthly HPR on State Street Monthly HPR on Russell 1000 -8.28% -0.78% -16.02% -4.74% 15.97% -0.68% -1.70% 11.75% 1.02% 0.06% 7.45% 1.03% -1.11% -4.12% 6.46% 1.67% 0.28% -6.31% 1.22% 0.27% -4.01% 0.25% -13.95% 3.23% 9.80% 0.54% 22.00% 0.66% 14.52% 3.86% 6.78% -0.27% -0.05% -8.38% -0.33% -1.61% 1.91% -4.69% 0.83% 4.04% 17.45% -0.22% 12.23% 1.32% -6.02% 1.88% -0.89% 2.48% 4.34% 4.07% -1.96% 3.82% -0.88% 8.05% 4.61% -0.34% 12.15% -2.19% 0.35% 1.47% 5.41% -0.57% 5.39% 1.28% 14.63% -4.37% -2.91% 0.71% -2.90% 11.68% 10.62% 1.43% 1.76% 0.08% 3.90% 0.79% -6.99% - 10.26% -0.79% 1.62% 5.60% -1.82% 3.75% 2.75% -1.72% 6.06% -3.71% 3.02% 6.48% 9.87% 3.64% 0.80% 15.43% 3.86% 2.81% 5.87% 6.70% 9.06% 12.87% -3.70% -0.85% -1.74% -3.65% -2.65% -2.76% -0.58% -5.65% 0.68% 9.34% 2.93% 0.05% 2.57% -10.82% 4.99% -3.68% 0.63% 9.93% 11.25% -2.71% 2.99% 0.60% -3.48% -5.13% 3.86% 6.04% 7.14% -1.59% -0.07% 0.31% 3.07% -3.06% -6.67% -11.59% -11.43% -17.94% 1.92% -7.94% 0.40% 6.21% -9.43% -17.31% -1.30% -12.98% 8.82% 11.86% 10.44% 12.41% 3.40% 6.21% 4.70% 1.37% 1.37% 3.95% -1.52% -7.78% 4.35% 4.71% 4.30% 2.81% -6.33% -15.78% -11.92% -18.34% 6.29% 12.06% 8.83% 2.32% 2.19% 9.75% 2.48% 3.62% -1.87% -16.83% -1.52% -11.67% 1.34% -16.83% 9.18% 4.12% 12.27% 9.50% -1.52% 11.15% -4.65% 4.68% 8.36% 4.95% -6.93% -7.43% 5.37% -11.67% 16.37% 11.62% 13.67% 6.02% -13.84% -24.65% 35.58% 1.77% 11.76% 14.75% 11.37% 0.34% 0.73% -2.47% -8.28% 15.72% 180.25% 1.34% 2.54% 3.81% 2.31% 0.60% -8.07% -13.82% 13.83% 5.16% 1.91% 6.31% 7.30% -4.10% -1.89% 11.69% 3.73% 3.12% -13.89% -21.79% 19.32% -3.30% 4.25% 1.20% 6.74% -12.87% 0.15% 19.66% 3.26% 2.62% 13.36% -0.54% -0.45% 14.89% 12.20% 4.35% 12.18% 5.23% 100.11% 1.3 T-Bill (decimal) Monthly T-Bill 0.0052 0.04% 0.0064 0.05% 0.0054 0.04% 0.0057 0.05% 0.0054 0.04% 0.005 0.04% 0.0055 0.05% 0.0058 0.05% 0.0064 0.05% 0.0071 0.06% 0.0084 0.07% 0.008 0.07% 0.0079 0.07% 0.0098 0.08% 0.0101 0.08% 0.0109 0.09% 0.0117 0.10% 0.0119 0.10% 0.012 0.10% 0.0125 0.10% 0.0136 0.11% 0.0151 0.12% 0.0165 0.14% 0.0175 0.14% 1.4 Excess Return on Best Buy -8.32% 15.92% 0.97% - 1.16% 0.24% 4.05% 9.76% 14.48% -0.11% % 1.85% 17.38% -6.08% Excess Return on Nike -0.83% -0.73% 0.02% -4.16% -6.36% 0.21% 0.50% 3.81% -8.43% -4.75% -0.29% 1.81% 4.01% 7.97% -2.27% -0.66% -4.46% 11.58% -0.01% -10.37% -1.93% 5.93% 9.74% 3.71% Excess Return o Excess Return on Russell 1000 -16.06% -4.78% -1.76% 11.70% 7.40% 0.98% 6.41% 1.62% 1.18% 0.22% -14.00% 3.18% 21.95% 0.62% 6.73% -0.32% -0.38% -1.66% 0.77% 3.98% 12.16% 1.25% -0.95% 2.41% -2.02% 3.75% 4.52% -0.42% 0.27% 1.39% 5.30% 1.19% -3.01% 0.62% 10.52% 1.34% 3.80% 0.69% -0.90% 1.52% 3.64% 2.64% -3.83% 2.89% 3.50% 0.66% 2.67% 5.72% 4.27% -0.96% 12.06% 5.32% 14.53% -2.99% 1.66% -7.10% 5.49% -1.85% 6.35% 15.29% Share Price and Yield Data Amount Amount 0.29 0.29 0.28 0.28 0.34 Best Buy Ex-Dividend Date 2/15/16 6/10/16 9/9/16 12/6/16 3/20/17 B/13/17 9/19/17 12/6/17 3/21/18 B/13/18 9/17/18 12/10/18 3/18/19 8/12/19 9/18/19 12/16/19 9/18/20 8/10/20 9/14/20 12/14/20 Nike Ex-Dividend Date 3/2/18 6/2/16 9/1/18 12/1/16 3/2/17 8/1/17 8/31/17 12/1/17 3/2/18 8/1/18 8/31/18 11/30/18 3/1/19 5/31/19 8/30/19 11/29/19 2/28/20 5/29/20 a/28/20 1214120 0.94 0.45 0.45 0.45 0.45 0.50 0.50 0.50 0.50 0.55 0.55 0.55 0.55 Amount 0.16 0.16 0.16 0.18 0.18 0.18 0.18 0.20 0.20 0.20 0.20 0.22 0.22 0.22 0.22 0.25 0.25 0.25 0.25 0.28 State Street Ex-Dividend Date 3/30/16 6/29/16 9/29/16 12/29/16 3/30/17 6/29/17 9/29/17 12/29/17 3/29/18 B/29/18 9/28/18 12/31/18 3/28/19 B/28/19 9/30/19 12/31/19 3/31/20 6/30/20 9/30/20 12/31/20 0.38 0.38 0.39 0.39 0.42 0.42 0.42 0.42 0.47 0.47 0.47 1.47 0.52 0.52 0.52 0.52 0.52 Date 12/31/15 1/31/16 2/28/16 3/31/16 4/30/16 5/31/16 6/30/16 7/31/18 B/31/18 9/30/16 10/31/16 11/30/16 12/31/16 1/31/17 2/28/17 3/31/17 4/30/17 6/31/17 6/30/17 7/31/17 8/31/17 9/30/17 10/31/17 11/30/17 12/31/17 1/31/18 2/28/18 3/31/18 4/30/18 5/31/18 6/30/18 7/31/18 B/31/18 9/30/18 10/31/18 11/30/18 12/31/18 1/31/19 2/28/19 3/31/19 4/30/19 5/31/19 BBY Best Buy 30.45 27.99 32.39 32.44 32.00 32.17 30.60 33.60 36.46 38.18 38.91 45.70 42.67 44.52 44.13 49.15 51.81 69.39 57.33 58.34 54.26 56.96 55.96 59.61 68.47 73.06 72.44 69.99 76.53 68.25 74.58 75.03 79.56 79.36 70.16 64.59 52.96 50 24 68.84 71.08 74.41 62.67 69.73 76.53 63.85 68.99 71.83 80.64 87.80 75.65 57.00 76.73 78.09 87.27 99.59 110.91 111.29 111.55 10B.BD 99.79 114.93 NKE Nike 62.50 62.01 61.59 61.47 58.94 55.22 55.20 55.50 67.84 52.65 50.18 50.07 50.83 52.90 57.16 55.73 55.41 52.99 59.00 59.05 52.81 51.85 54.99 60.42 62.55 68.22 67.03 66.44 68.39 71.80 79.68 76.91 82.20 84.72 75.04 75.12 74.14 81.88 85.73 84.21 87.83 77.14 83.95 86.03 84.50 93.92 89.55 93.49 101.31 96.30 89.38 82.74 87.18 98.56 98.05 97.61 111.89 125.64 120.00 134 70 141.47 STT State Street 66.36 55.73 54.78 58.52 62.30 63.06 53.92 65.78 70.24 69.63 70.21 78.80 77.72 76.20 79.71 79.61 83.90 81,46 89.73 93.23 92.49 95.54 92.00 95.35 97.61 110.17 106.15 99.73 99.78 96.11 93.09 88.31 86.91 83.78 68.75 73.02 63.07 70.90 71.87 65.81 67.66 55.25 56.06 58.09 51.31 59.19 66.07 75.10 79.10 68.11 53.27 63.04 60.96 63.55 63.79 68.09 59.33 58.90 70.48 72.78 74.17 RUI Russell 1000 5798.184 5521.7100 5170.51500 8233.2150 6337.7490 6354.6020 5559.5550 6603.0760 8585.0350 6479.2330 6740.9920 6829.8910 1999.1720 7266.2060 7241.3780 7347.9370 7442.1340 7495.3270 7602.8240 7662.7620 7786.9020 B001.2940 8242.8290 8308.8020 8796.1390 8470.4520 8248.4150 9302.3120 85160160 8569.5820 8825.57700 9165.BRDO 9159.0930 0548.3500 8712.7960 7891.1890 9587.5160 8879.9080 3001.2140 9392.7100 8796.1260 9351.9220 9556.6840 9378.2100 9504.1290 9745.7430 10117,0310 10350.8270 10413.1170 9573.1430 249.9350 9390.7000 9874.8590 10063.0130 10698.3390 11479.5220 11008.9290 10800.5880 12063.4820 12512.9590 12903 5800 1-Year T-Bill Annual YTM 0.5200 0.6400 FA 0.5400 0.5700 0.5400 0.5000 0.5500 0.5800 0.8400 0.7100 0.84001 0.8000 0.7900 0.9800 1.0100 1.0900 1.1700 1.1900 1.2000 1.2500 1.3600 1.5100 1.6500 1.7500 1.9000 2.0000 2.0800 2.2000 2.2500 2.3100 2.3600 2.4700 2.5600 2.6000 2.5700 2.5000 2.4700 2.4100 2.3400 2.2700 1.9400 1.9100 1.7300 1.7500 1.5700 1.5300 1.5100 1.4900 1.3700 0.3200 0.1800 0.1600 0.1800 0.15001 0.1300 0.1300 0.1300 0.1200 0.1000 0.1000 0.0700 6/30/19 7/31/19 8/31/19 9/30/19 10/31/19 11/30/19 12/31/19 1/31/20 2/29/20 3/31/20 4/30/20 5/31/20 6/30/20 7/31/20 8/31/20 8/30/20 10/31/20 11/30/20 12/31/20 1.1 1.2 Monthly HPR on Best Buy Monthly HPR on Nike Monthly HPR on State Street Monthly HPR on Russell 1000 -8.28% -0.78% -16.02% -4.74% 15.97% -0.68% -1.70% 11.75% 1.02% 0.06% 7.45% 1.03% -1.11% -4.12% 6.46% 1.67% 0.28% -6.31% 1.22% 0.27% -4.01% 0.25% -13.95% 3.23% 9.80% 0.54% 22.00% 0.66% 14.52% 3.86% 6.78% -0.27% -0.05% -8.38% -0.33% -1.61% 1.91% -4.69% 0.83% 4.04% 17.45% -0.22% 12.23% 1.32% -6.02% 1.88% -0.89% 2.48% 4.34% 4.07% -1.96% 3.82% -0.88% 8.05% 4.61% -0.34% 12.15% -2.19% 0.35% 1.47% 5.41% -0.57% 5.39% 1.28% 14.63% -4.37% -2.91% 0.71% -2.90% 11.68% 10.62% 1.43% 1.76% 0.08% 3.90% 0.79% -6.99% - 10.26% -0.79% 1.62% 5.60% -1.82% 3.75% 2.75% -1.72% 6.06% -3.71% 3.02% 6.48% 9.87% 3.64% 0.80% 15.43% 3.86% 2.81% 5.87% 6.70% 9.06% 12.87% -3.70% -0.85% -1.74% -3.65% -2.65% -2.76% -0.58% -5.65% 0.68% 9.34% 2.93% 0.05% 2.57% -10.82% 4.99% -3.68% 0.63% 9.93% 11.25% -2.71% 2.99% 0.60% -3.48% -5.13% 3.86% 6.04% 7.14% -1.59% -0.07% 0.31% 3.07% -3.06% -6.67% -11.59% -11.43% -17.94% 1.92% -7.94% 0.40% 6.21% -9.43% -17.31% -1.30% -12.98% 8.82% 11.86% 10.44% 12.41% 3.40% 6.21% 4.70% 1.37% 1.37% 3.95% -1.52% -7.78% 4.35% 4.71% 4.30% 2.81% -6.33% -15.78% -11.92% -18.34% 6.29% 12.06% 8.83% 2.32% 2.19% 9.75% 2.48% 3.62% -1.87% -16.83% -1.52% -11.67% 1.34% -16.83% 9.18% 4.12% 12.27% 9.50% -1.52% 11.15% -4.65% 4.68% 8.36% 4.95% -6.93% -7.43% 5.37% -11.67% 16.37% 11.62% 13.67% 6.02% -13.84% -24.65% 35.58% 1.77% 11.76% 14.75% 11.37% 0.34% 0.73% -2.47% -8.28% 15.72% 180.25% 1.34% 2.54% 3.81% 2.31% 0.60% -8.07% -13.82% 13.83% 5.16% 1.91% 6.31% 7.30% -4.10% -1.89% 11.69% 3.73% 3.12% -13.89% -21.79% 19.32% -3.30% 4.25% 1.20% 6.74% -12.87% 0.15% 19.66% 3.26% 2.62% 13.36% -0.54% -0.45% 14.89% 12.20% 4.35% 12.18% 5.23% 100.11% 1.3 T-Bill (decimal) Monthly T-Bill 0.0052 0.04% 0.0064 0.05% 0.0054 0.04% 0.0057 0.05% 0.0054 0.04% 0.005 0.04% 0.0055 0.05% 0.0058 0.05% 0.0064 0.05% 0.0071 0.06% 0.0084 0.07% 0.008 0.07% 0.0079 0.07% 0.0098 0.08% 0.0101 0.08% 0.0109 0.09% 0.0117 0.10% 0.0119 0.10% 0.012 0.10% 0.0125 0.10% 0.0136 0.11% 0.0151 0.12% 0.0165 0.14% 0.0175 0.14% 1.4 Excess Return on Best Buy -8.32% 15.92% 0.97% - 1.16% 0.24% 4.05% 9.76% 14.48% -0.11% % 1.85% 17.38% -6.08% Excess Return on Nike -0.83% -0.73% 0.02% -4.16% -6.36% 0.21% 0.50% 3.81% -8.43% -4.75% -0.29% 1.81% 4.01% 7.97% -2.27% -0.66% -4.46% 11.58% -0.01% -10.37% -1.93% 5.93% 9.74% 3.71% Excess Return o Excess Return on Russell 1000 -16.06% -4.78% -1.76% 11.70% 7.40% 0.98% 6.41% 1.62% 1.18% 0.22% -14.00% 3.18% 21.95% 0.62% 6.73% -0.32% -0.38% -1.66% 0.77% 3.98% 12.16% 1.25% -0.95% 2.41% -2.02% 3.75% 4.52% -0.42% 0.27% 1.39% 5.30% 1.19% -3.01% 0.62% 10.52% 1.34% 3.80% 0.69% -0.90% 1.52% 3.64% 2.64% -3.83% 2.89% 3.50% 0.66% 2.67% 5.72% 4.27% -0.96% 12.06% 5.32% 14.53% -2.99% 1.66% -7.10% 5.49% -1.85% 6.35% 15.29%
Step by Step Solution
There are 3 Steps involved in it
Step: 1

Get Instant Access to Expert-Tailored Solutions
See step-by-step solutions with expert insights and AI powered tools for academic success
Step: 2

Step: 3

Ace Your Homework with AI
Get the answers you need in no time with our AI-driven, step-by-step assistance
Get Started


