Question
Two observable quality characteristic and 2 of a production process is recorded for m = 50 samples with a sample size of n =

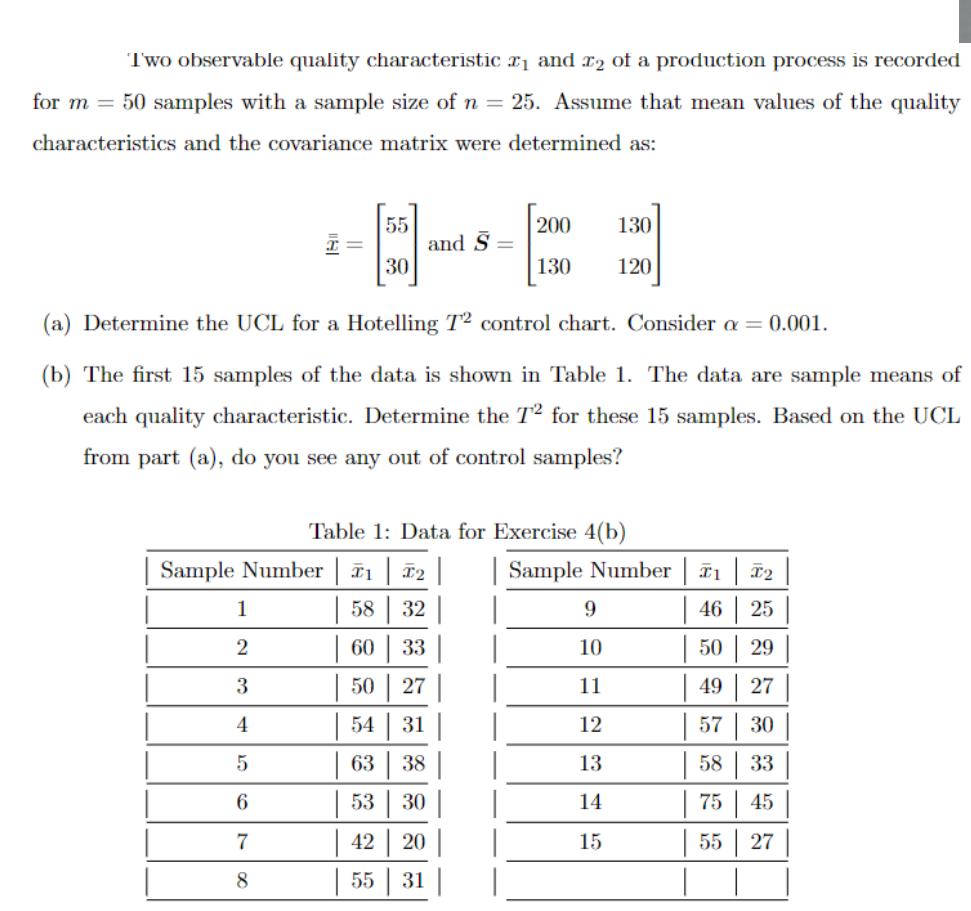
Two observable quality characteristic and 2 of a production process is recorded for m = 50 samples with a sample size of n = 25. Assume that mean values of the quality characteristics and the covariance matrix were determined as: I =- 1 2 3 4 5 6 55 30 7 8 and S = (a) Determine the UCL for a Hotelling 72 control chart. Consider a = 0.001. (b) The first 15 samples of the data is shown in Table 1. The data are sample means of each quality characteristic. Determine the T2 for these 15 samples. Based on the UCL from part (a), do you see any out of control samples? Sample Number T T2 | 58 | 32 | 60 | 33 50 27 54 31 63 38 53 30 42 20 55 31 200 130 130 120 Table 1: Data for Exercise 4(b) Sample Number 9 10 11 12 13 14 15 I1 I2 46 25 50 29 49 27 57 30 58 33 75 45 55 27
Step by Step Solution
3.29 Rating (155 Votes )
There are 3 Steps involved in it
Step: 1

Get Instant Access to Expert-Tailored Solutions
See step-by-step solutions with expert insights and AI powered tools for academic success
Step: 2

Step: 3

Ace Your Homework with AI
Get the answers you need in no time with our AI-driven, step-by-step assistance
Get StartedRecommended Textbook for
Advanced Accounting
Authors: Gail Fayerman
1st Canadian Edition
9781118774113, 1118774116, 111803791X, 978-1118037911
Students also viewed these Accounting questions
Question
Answered: 1 week ago
Question
Answered: 1 week ago
Question
Answered: 1 week ago
Question
Answered: 1 week ago
Question
Answered: 1 week ago
Question
Answered: 1 week ago
Question
Answered: 1 week ago
Question
Answered: 1 week ago
Question
Answered: 1 week ago
Question
Answered: 1 week ago
Question
Answered: 1 week ago
Question
Answered: 1 week ago
Question
Answered: 1 week ago
Question
Answered: 1 week ago
Question
Answered: 1 week ago
Question
Answered: 1 week ago
Question
Answered: 1 week ago
Question
Answered: 1 week ago
Question
Answered: 1 week ago
Question
Answered: 1 week ago
Question
Answered: 1 week ago
Question
Answered: 1 week ago
Question
Answered: 1 week ago
Question
Answered: 1 week ago
View Answer in SolutionInn App


