

Question: formulas Hints for Working on this Assignment This exercises is a bit like solving a puzzle. First, you do the easy formulas to fill in
formulas
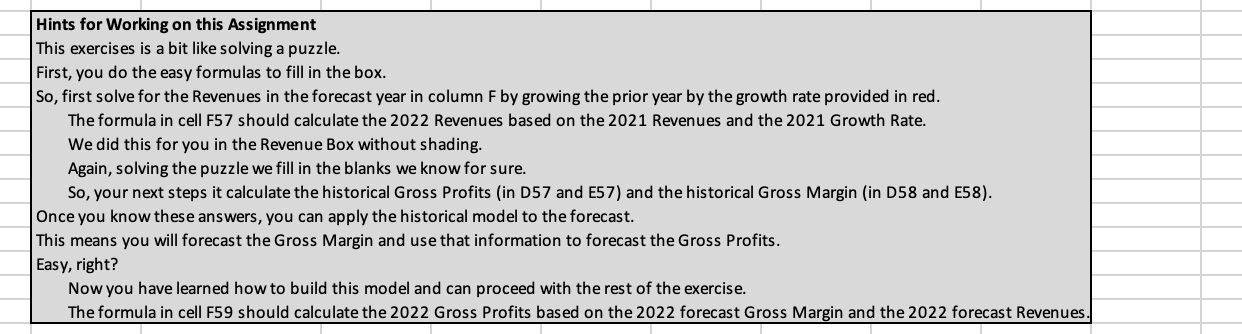
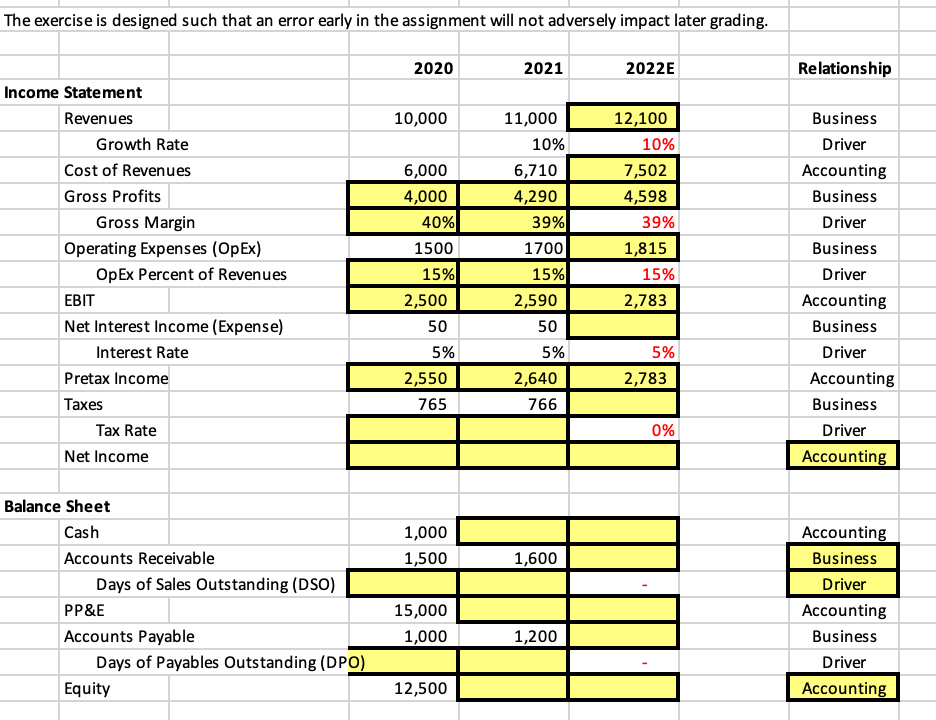
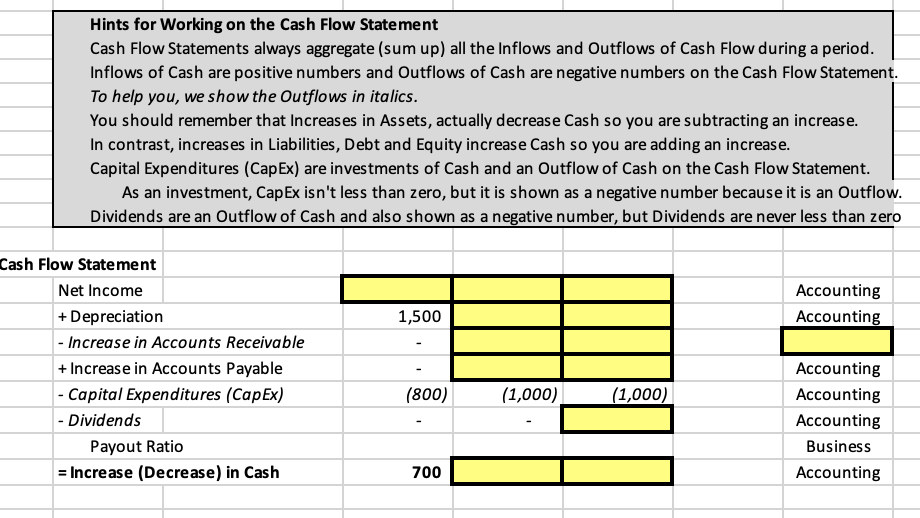
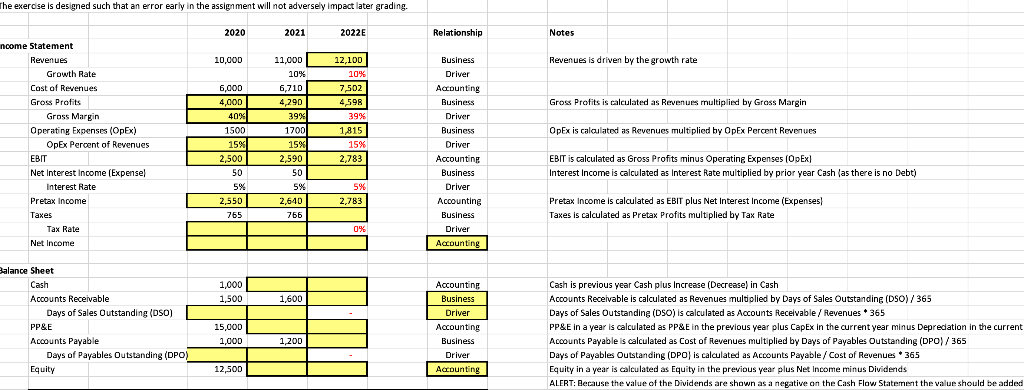
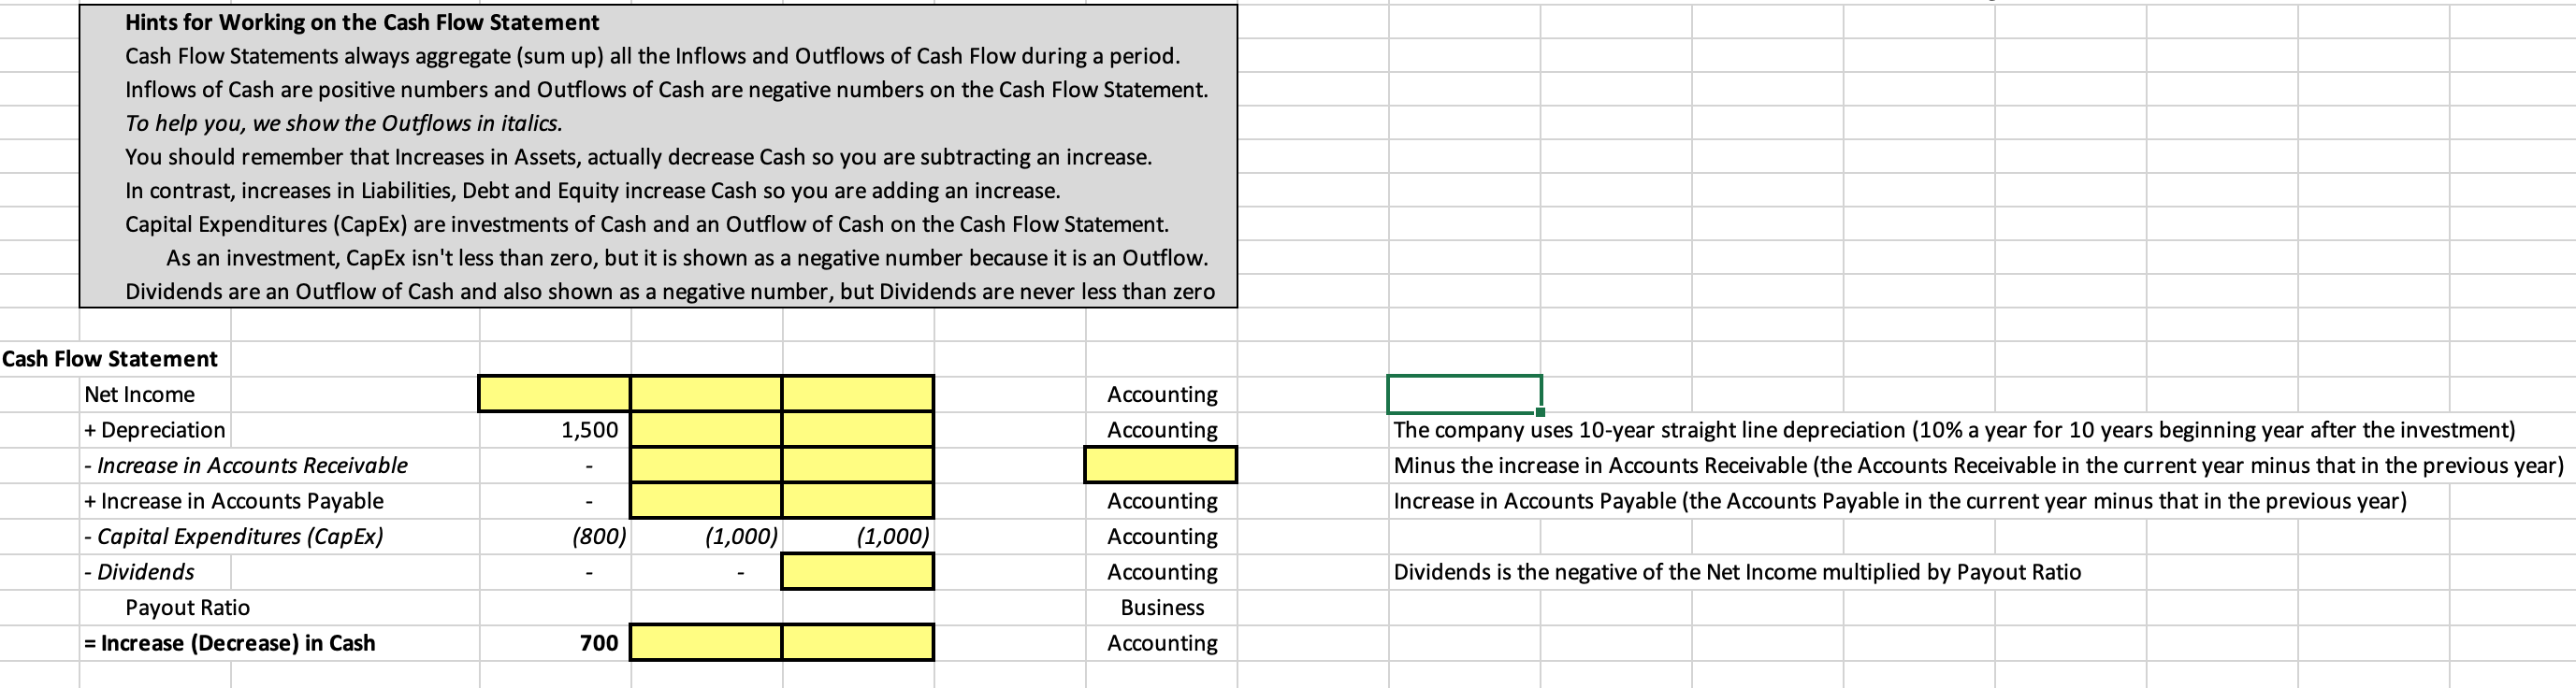
Hints for Working on this Assignment This exercises is a bit like solving a puzzle. First, you do the easy formulas to fill in the box. So, first solve for the Revenues in the forecast year in column F by growing the prior year by the growth rate provided in red. The formula in cell F57 should calculate the 2022 Revenues based on the 2021 Revenues and the 2021 Growth Rate. We did this for you in the Revenue Box without shading. Again, solving the puzzle we fill in the blanks we know for sure. So, your next steps it calculate the historical Gross Profits (in D57 and E57) and the historical Gross Margin (in D58 and E58). Once you know these answers, you can apply the historical model to the forecast. This means you will forecast the Gross Margin and use that information to forecast the Gross Profits. Easy, right? Now you have learned how to build this model and can proceed with the rest of the exercise. The formula in cell F59 should calculate the 2022 Gross Profits based on the 2022 forecast Gross Margin and the 2022 forecast Revenues. The exercise is designed such that an error early in the assignment will not adversely impact later grading. 2020 2021 2022E Relationship 10,000 Income Statement Revenues Growth Rate Cost of Revenues Gross Profits Gross Margin Operating Expenses (Opex) OpEx Percent of Revenues EBIT Net Interest Income (Expense) Interest Rate Pretax Income Taxes Tax Rate Net Income 6,000 4,000 40% 1500 15% 2,500 50 5% 2,550 765 11,000 12,100 10% 10% 6,710 7,502 4,290 4,598 39% 39% 1700 1,815 15% 15% 2,590 2,783 50 5% 5% 2,640 2,783 766 0% Business Driver Accounting Business Driver Business Driver Accounting Business Driver Accounting Business Driver Accounting 1,000 1,500 1,600 Balance Sheet Cash Accounts Receivable Days of Sales Outstanding (DSO) PP &E Accounts Payable Days of Payables Outstanding (DPO) Equity 15,000 1,000 Accounting Business Driver Accounting Business Driver Accounting 1,200 12,500 Hints for Working on the Cash Flow Statement Cash Flow Statements always aggregate (sum up) all the inflows and Outflows of Cash Flow during a period. Inflows of Cash are positive numbers and Outflows of Cash are negative numbers on the Cash Flow Statement. To help you, we show the Outflows in italics. You should remember that Increases in Assets, actually decrease Cash so you are subtracting an increase. In contrast, increases in Liabilities, Debt and Equity increase Cash so you are adding an increase. Capital Expenditures (CapEx) are investments of Cash and an Outflow of Cash on the Cash Flow Statement. As an investment, CapEx isn't less than zero, but it is shown as a negative number because it is an Outflow. Dividends are an Outflow of Cash and also shown as a negative number, but Dividends are never less than zero Accounting Accounting 1,500 Cash Flow Statement Net Income + Depreciation - Increase in Accounts Receivable + Increase in Accounts Payable - Capital Expenditures (Capex) - Dividends Payout Ratio = Increase (Decrease) in Cash (800) (1,000) (1,000) Accounting Accounting Accounting Business Accounting 700 the exercise is designed such that an error early in the assignment will not adversely impact later grading. 2020 2021 2022E Relationship Notes 10,000 Revenues is driven by the growth rate Gross Profits is calculated as Revenues multiplied by Gross Margin income Statement Revenues Growth Rate Cost of Revenues Gross Profits Gross Margin Operating Expenses (Opex) OpEx Percent of Revenues EBIT Net Interest Income (Expense! Interest Rate Pretax income Taxes Tax Rate Net Income OpEx is calculated as Revenues multiplied by OpEx Percent Revenues 6,000 4,000 40% 1500 15% 2,500 50 5% 2,550 755 11,000 10% 6,710 4,290 39% 17001 15% 2,590 50 5% 2,640 766 12,100 10% 7,502 4,598 39% 1,815 15% 2,783 Business Driver Accounting Business Driver Business Driver Accounting Business Driver Accounting Business Driver Accounting EBIT is calculated as Gross Profits minus Operating Expenses (OpEx) Interest Income is calculated as Interest Rate multiplied by prior year Cash (as there is no Debt) 5% 2,783 Pretax income is calculated as EBIT plus Net Interest Income (Expenses Taxes is calculated as Pretax Profits multiplied by Tax Rate 0% 1,000 1,500 1,600 Balance Sheet Cash Accounts Receivable Days of Sales Outstanding (DSO) PP&E Accounts Payable Days of Payables Outstanding (DPO) Equity 15,000 1,000 Accounting Business Driver Accounting Business Driver Accounting Cash is previous year Cash plus Increase (Decrease) in Cash Accounts Receivable is calculated as Revenues multiplied by Days of Sales Outstanding (DSO)/365 Days of Sales Outstanding (DSO) is calculated as Accounts Receivable / Revenues * 365 PP&E in a year is calculated as PP&E in the previous year plus Capex in the current year minus Depredation in the current Accounts Payable is calculated as Cost of Revenues multiplied by Days of Payables Outstanding (DPO)/365 Days of Payables Outstanding (DPO) is calculated as Accounts Payable / Cost of Revenues 365 Equity in a year is calculated as Equity in the previous year plus Net Income minus Dividends ALERT: Because the value of the Dividends are shown as a negative on the Cash Flow Statement the value should be added 1,200 12,500 Hints for Working on the Cash Flow Statement Cash Flow Statements always aggregate (sum up) all the inflows and Outflows of Cash Flow during a period. Inflows of Cash are positive numbers and Outflows of Cash are negative numbers on the Cash Flow Statement. To help you, we show the Outflows in italics. You should remember that Increases in Assets, actually decrease Cash so you are subtracting an increase. In contrast, increases in Liabilities, Debt and Equity increase Cash so you are adding an increase. Capital Expenditures (CapEx) are investments of Cash and an Outflow of Cash on the Cash Flow Statement. As an investment, CapEx isn't less than zero, but it is shown as a negative number because it is an Outflow. Dividends are an Outflow of Cash and also shown as a negative number, but Dividends are never less than zero Cash Flow Statement Net Income Accounting Accounting 1,500 The company uses 10-year straight line depreciation (10% a year for 10 years beginning year after the investment) Minus the increase in Accounts Receivable (the Accounts Receivable in the current year minus that in the previous year) Increase in Accounts Payable (the Accounts Payable in the current year minus that in the previous year) + Depreciation - Increase in Accounts Receivable + Increase in Accounts Payable - Capital Expenditures (CapEx) - Dividends Payout Ratio = Increase (Decrease) in Cash (800) (1,000) (1,000) Accounting Accounting Accounting Business Accounting Dividends is the negative of the Net Income multiplied by Payout Ratio 700 Hints for Working on this Assignment This exercises is a bit like solving a puzzle. First, you do the easy formulas to fill in the box. So, first solve for the Revenues in the forecast year in column F by growing the prior year by the growth rate provided in red. The formula in cell F57 should calculate the 2022 Revenues based on the 2021 Revenues and the 2021 Growth Rate. We did this for you in the Revenue Box without shading. Again, solving the puzzle we fill in the blanks we know for sure. So, your next steps it calculate the historical Gross Profits (in D57 and E57) and the historical Gross Margin (in D58 and E58). Once you know these answers, you can apply the historical model to the forecast. This means you will forecast the Gross Margin and use that information to forecast the Gross Profits. Easy, right? Now you have learned how to build this model and can proceed with the rest of the exercise. The formula in cell F59 should calculate the 2022 Gross Profits based on the 2022 forecast Gross Margin and the 2022 forecast Revenues. The exercise is designed such that an error early in the assignment will not adversely impact later grading. 2020 2021 2022E Relationship 10,000 Income Statement Revenues Growth Rate Cost of Revenues Gross Profits Gross Margin Operating Expenses (Opex) OpEx Percent of Revenues EBIT Net Interest Income (Expense) Interest Rate Pretax Income Taxes Tax Rate Net Income 6,000 4,000 40% 1500 15% 2,500 50 5% 2,550 765 11,000 12,100 10% 10% 6,710 7,502 4,290 4,598 39% 39% 1700 1,815 15% 15% 2,590 2,783 50 5% 5% 2,640 2,783 766 0% Business Driver Accounting Business Driver Business Driver Accounting Business Driver Accounting Business Driver Accounting 1,000 1,500 1,600 Balance Sheet Cash Accounts Receivable Days of Sales Outstanding (DSO) PP &E Accounts Payable Days of Payables Outstanding (DPO) Equity 15,000 1,000 Accounting Business Driver Accounting Business Driver Accounting 1,200 12,500 Hints for Working on the Cash Flow Statement Cash Flow Statements always aggregate (sum up) all the inflows and Outflows of Cash Flow during a period. Inflows of Cash are positive numbers and Outflows of Cash are negative numbers on the Cash Flow Statement. To help you, we show the Outflows in italics. You should remember that Increases in Assets, actually decrease Cash so you are subtracting an increase. In contrast, increases in Liabilities, Debt and Equity increase Cash so you are adding an increase. Capital Expenditures (CapEx) are investments of Cash and an Outflow of Cash on the Cash Flow Statement. As an investment, CapEx isn't less than zero, but it is shown as a negative number because it is an Outflow. Dividends are an Outflow of Cash and also shown as a negative number, but Dividends are never less than zero Accounting Accounting 1,500 Cash Flow Statement Net Income + Depreciation - Increase in Accounts Receivable + Increase in Accounts Payable - Capital Expenditures (Capex) - Dividends Payout Ratio = Increase (Decrease) in Cash (800) (1,000) (1,000) Accounting Accounting Accounting Business Accounting 700 the exercise is designed such that an error early in the assignment will not adversely impact later grading. 2020 2021 2022E Relationship Notes 10,000 Revenues is driven by the growth rate Gross Profits is calculated as Revenues multiplied by Gross Margin income Statement Revenues Growth Rate Cost of Revenues Gross Profits Gross Margin Operating Expenses (Opex) OpEx Percent of Revenues EBIT Net Interest Income (Expense! Interest Rate Pretax income Taxes Tax Rate Net Income OpEx is calculated as Revenues multiplied by OpEx Percent Revenues 6,000 4,000 40% 1500 15% 2,500 50 5% 2,550 755 11,000 10% 6,710 4,290 39% 17001 15% 2,590 50 5% 2,640 766 12,100 10% 7,502 4,598 39% 1,815 15% 2,783 Business Driver Accounting Business Driver Business Driver Accounting Business Driver Accounting Business Driver Accounting EBIT is calculated as Gross Profits minus Operating Expenses (OpEx) Interest Income is calculated as Interest Rate multiplied by prior year Cash (as there is no Debt) 5% 2,783 Pretax income is calculated as EBIT plus Net Interest Income (Expenses Taxes is calculated as Pretax Profits multiplied by Tax Rate 0% 1,000 1,500 1,600 Balance Sheet Cash Accounts Receivable Days of Sales Outstanding (DSO) PP&E Accounts Payable Days of Payables Outstanding (DPO) Equity 15,000 1,000 Accounting Business Driver Accounting Business Driver Accounting Cash is previous year Cash plus Increase (Decrease) in Cash Accounts Receivable is calculated as Revenues multiplied by Days of Sales Outstanding (DSO)/365 Days of Sales Outstanding (DSO) is calculated as Accounts Receivable / Revenues * 365 PP&E in a year is calculated as PP&E in the previous year plus Capex in the current year minus Depredation in the current Accounts Payable is calculated as Cost of Revenues multiplied by Days of Payables Outstanding (DPO)/365 Days of Payables Outstanding (DPO) is calculated as Accounts Payable / Cost of Revenues 365 Equity in a year is calculated as Equity in the previous year plus Net Income minus Dividends ALERT: Because the value of the Dividends are shown as a negative on the Cash Flow Statement the value should be added 1,200 12,500 Hints for Working on the Cash Flow Statement Cash Flow Statements always aggregate (sum up) all the inflows and Outflows of Cash Flow during a period. Inflows of Cash are positive numbers and Outflows of Cash are negative numbers on the Cash Flow Statement. To help you, we show the Outflows in italics. You should remember that Increases in Assets, actually decrease Cash so you are subtracting an increase. In contrast, increases in Liabilities, Debt and Equity increase Cash so you are adding an increase. Capital Expenditures (CapEx) are investments of Cash and an Outflow of Cash on the Cash Flow Statement. As an investment, CapEx isn't less than zero, but it is shown as a negative number because it is an Outflow. Dividends are an Outflow of Cash and also shown as a negative number, but Dividends are never less than zero Cash Flow Statement Net Income Accounting Accounting 1,500 The company uses 10-year straight line depreciation (10% a year for 10 years beginning year after the investment) Minus the increase in Accounts Receivable (the Accounts Receivable in the current year minus that in the previous year) Increase in Accounts Payable (the Accounts Payable in the current year minus that in the previous year) + Depreciation - Increase in Accounts Receivable + Increase in Accounts Payable - Capital Expenditures (CapEx) - Dividends Payout Ratio = Increase (Decrease) in Cash (800) (1,000) (1,000) Accounting Accounting Accounting Business Accounting Dividends is the negative of the Net Income multiplied by Payout Ratio 700
Step by Step Solution
There are 3 Steps involved in it

Get step-by-step solutions from verified subject matter experts