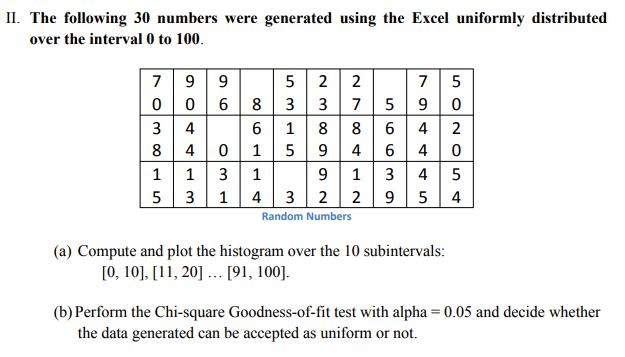
II. The following 30 numbers were generated using the Excel uniformly distributed over the interval 0 to 100. 96 7 9 9 0 0

II. The following 30 numbers were generated using the Excel uniformly distributed over the interval 0 to 100. 96 7 9 9 0 0 6 8 3 4 8 4 0 69 1 15 1 1 3 5 3 1 14 5 238952 5315 2 2 5 7 5 SO2054 7944 4 45 56639 2 78 412 9 1 3 Random Numbers (a) Compute and plot the histogram over the 10 subintervals: [0, 10], [11, 20] [91, 100]. (b) Perform the Chi-square Goodness-of-fit test with alpha = 0.05 and decide whether the data generated can be accepted as uniform or not.
Step by Step Solution
3.38 Rating (157 Votes )
There are 3 Steps involved in it
Step: 1
To solve this problem well use Python and the necessary libraries python import numpy as np import matplotlibpyplot as plt from scipystats import chi2 ...
See step-by-step solutions with expert insights and AI powered tools for academic success
Step: 2

Step: 3

Document Format ( 2 attachments)
6642f52bbb26a_971820.pdf
180 KBs PDF File
6642f52bbb26a_971820.docx
120 KBs Word File
Ace Your Homework with AI
Get the answers you need in no time with our AI-driven, step-by-step assistance
Get Started


