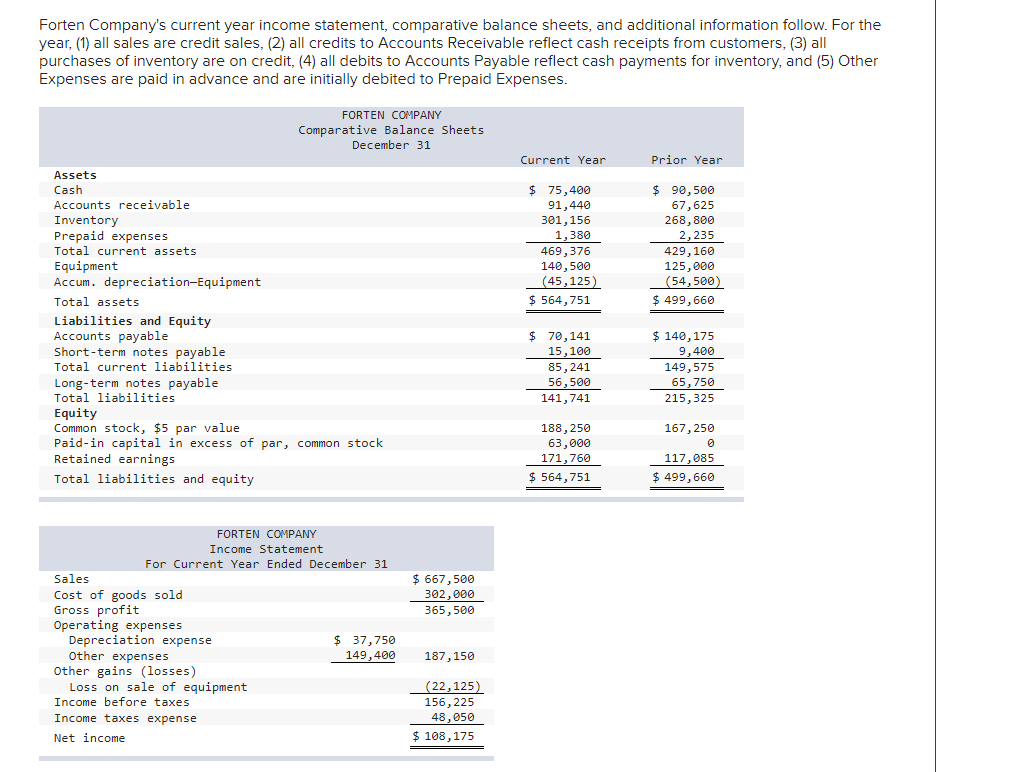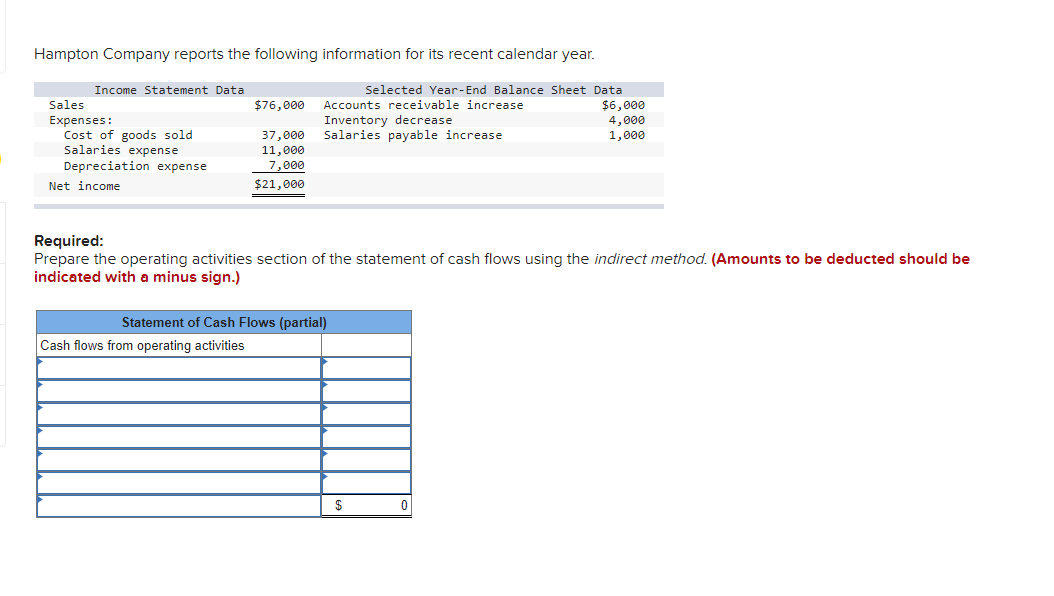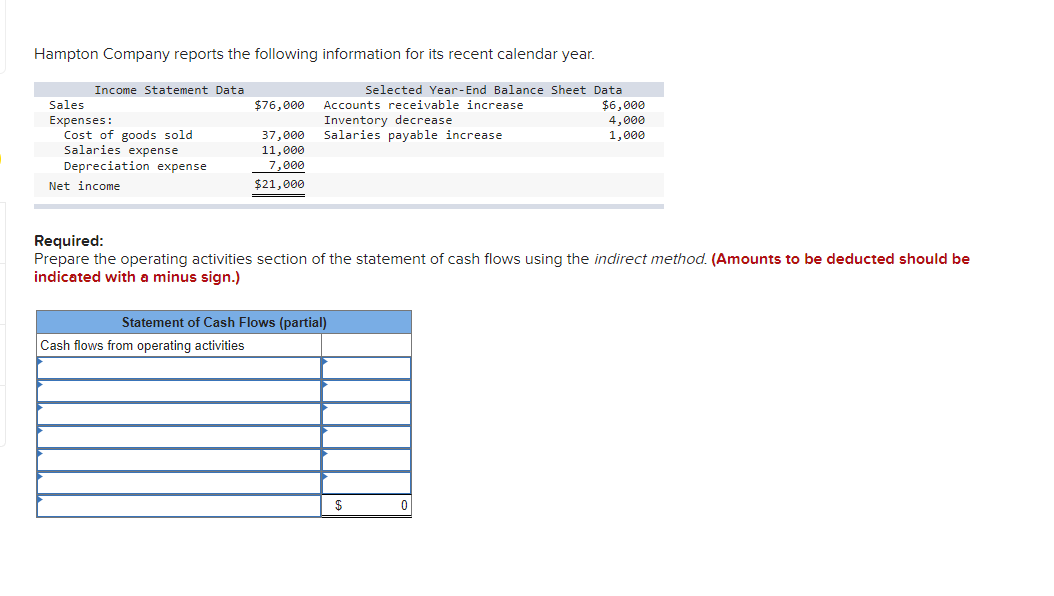


Forten Company's current year income statement, comparative balance sheets, and additional information follow. For the year, (1) all sales are credit sales, (2) all credits to Accounts Receivable reflect cash receipts from customers, (3) all purchases of inventory are on credit, (4) all debits to Accounts Payable reflect cash payments for inventory, and (5) Other Expenses are paid in advance and are initially debited to Prepaid Expenses. FORTEN COMPANY Comparative Balance Sheets December 31 Current Year Prior Year $ 75,400 91,440 301,156 1,380 469,376 140,500 (45,125) $ 564,751 $ 90,500 67,625 268,800 2,235 429,160 125,000 (54,500) $ 499,660 Assets Cash Accounts receivable Inventory Prepaid expenses Total current assets Equipment Accum. depreciation-Equipment Total assets Liabilities and Equity Accounts payable Short-term notes payable Total current liabilities Long-term notes payable Total liabilities Equity Common stock, $5 par value Paid-in capital in excess of par, common stock Retained earnings Total liabilities and equity $ 70,141 15,100 85,241 56,500 141,741 $ 140, 175 9,400 149,575 65,750 215,325 167,250 188,250 63,000 171,760 $ 564,751 117,085 $ 499,660 $ 667,500 302,000 365,500 FORTEN COMPANY Income Statement For Current Year Ended December 31 Sales Cost of goods sold Gross profit Operating expenses Depreciation expense $ 37,750 Other expenses 149,400 Other gains (losses) Loss on sale of equipment Income before taxes Income taxes expense Net income 187,150 (22, 125) 156, 225 48,050 $ 108, 175 Hampton Company reports the following information for its recent calendar year. $76,000 Income Statement Data Sales Expenses: Cost of goods sold Salaries expense Depreciation expense Net income Selected Year-End Balance Sheet Data Accounts receivable increase $6,000 Inventory decrease 4,000 Salaries payable increase 1,000 37,000 11,000 7,000 $21,000 Required: Prepare the operating activities section of the statement of cash flows using the indirect method. (Amounts to be deducted should be indicated with a minus sign.) Statement of Cash Flows (partial) Cash flows from operating activities $ 0 Hampton Company reports the following information for its recent calendar year. $76,000 Income Statement Data Sales Expenses: Cost of goods sold Salaries expense Depreciation expense Net income Selected Year-End Balance Sheet Data Accounts receivable increase $6,000 Inventory decrease 4,000 Salaries payable increase 1,000 37,000 11,000 7,000 $21,000 Required: Prepare the operating activities section of the statement of cash flows using the indirect method. (Amounts to be deducted should be indicated with a minus sign.) Statement of Cash Flows (partial) Cash flows from operating activities $ 0


