Answered step by step
Verified Expert Solution
Question
1 Approved Answer
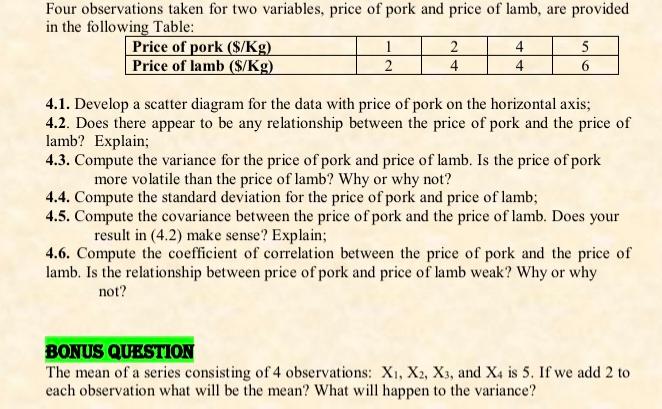
Four observations taken for two variables, price of pork and price of lamb, are provided in the following Table: Price of pork ($/Kg) Price

Four observations taken for two variables, price of pork and price of lamb, are provided in the following Table: Price of pork ($/Kg) Price of lamb ($/Kg) 1 2 2 4 4 4 5 6 4.1. Develop a scatter diagram for the data with price of pork on the horizontal axis; 4.2. Does there appear to be any relationship between the price of pork and the price of lamb? Explain; 4.3. Compute the variance for the price of pork and price of lamb. Is the price of pork more volatile than the price of lamb? Why or why not? 4.4. Compute the standard deviation for the price of pork and price of lamb; 4.5. Compute the covariance between the price of pork and the price of lamb. Does your result in (4.2) make sense? Explain; 4.6. Compute the coefficient of correlation between the price of pork and the price of lamb. Is the relationship between price of pork and price of lamb weak? Why or why not? BONUS QUESTION The mean of a series consisting of 4 observations: X, X2, X3, and X4 is 5. If we add 2 to each observation what will be the mean? What will happen to the variance?
Step by Step Solution
★★★★★
3.28 Rating (151 Votes )
There are 3 Steps involved in it
Step: 1
Lets go through each of your questions step by step 41 To develop a scatter diagram with the price of pork on the horizontal axis you can plot the dat...
Get Instant Access to Expert-Tailored Solutions
See step-by-step solutions with expert insights and AI powered tools for academic success
Step: 2

Step: 3

Ace Your Homework with AI
Get the answers you need in no time with our AI-driven, step-by-step assistance
Get Started


