fQ1. Perform and Interpret a One-Sample t Test [14 points total] The average MMSE score is around 26.4 in the general population aged 75 and
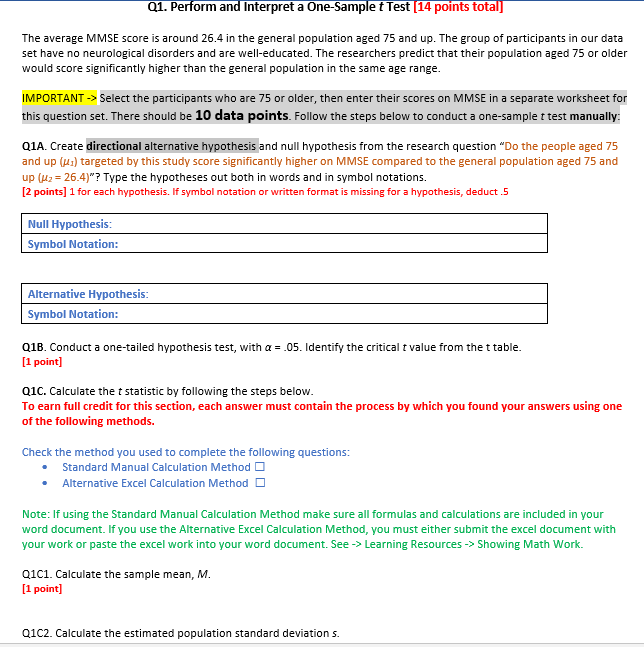
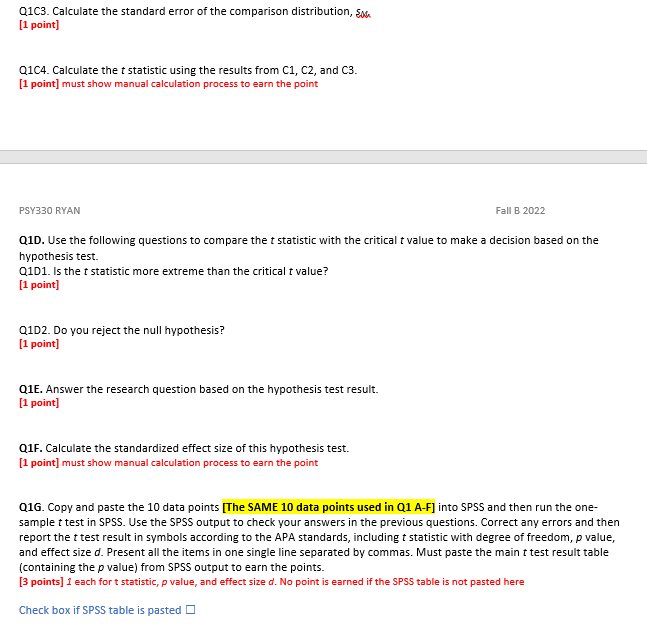
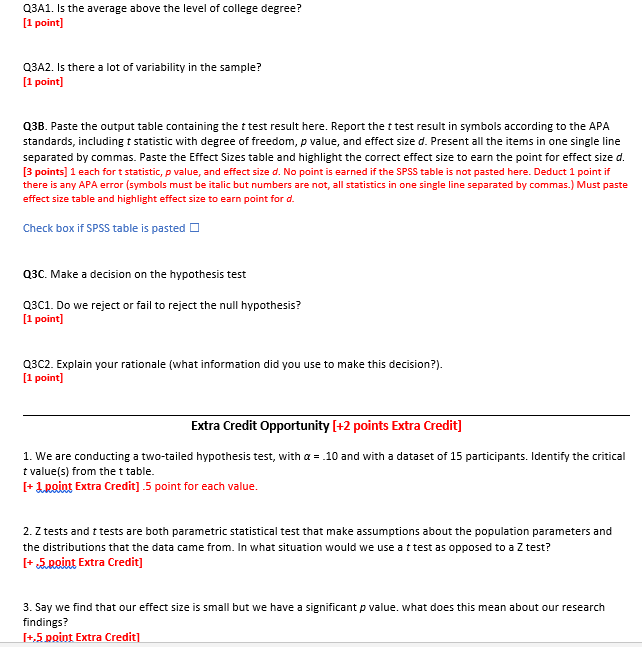
\fQ1. Perform and Interpret a One-Sample t Test [14 points total] The average MMSE score is around 26.4 in the general population aged 75 and up. The group of participants in our data set have no neurological disorders and are well-educated. The researchers predict that their population aged 75 or older would score significantly higher than the general population in the same age range. IMPORTANT -> Select the participants who are 75 or older, then enter their scores on MMSE in a separate worksheet for this question set. There should be 10 data points. Follow the steps below to conduct a one-sample t test manually: Q1A. Create directional alternative hypothesis and null hypothesis from the research question "Do the people aged 75 and up () targeted by this study score significantly higher on MMSE compared to the general population aged 75 and up (uz = 26.4)"? Type the hypotheses out both in words and in symbol notations. [2 points] 1 for each hypothesis. If symbol notation or written format is missing for a hypothesis, deduct .5 Null Hypothesis: Symbol Notation: Alternative Hypothesis: Symbol Notation: Q18. Conduct a one-tailed hypothesis test, with a = .05. Identify the critical f value from the t table. [1 point] Q1C. Calculate the t statistic by following the steps below. To earn full credit for this section, each answer must contain the process by which you found your answers using one of the following methods. Check the method you used to complete the following questions: Standard Manual Calculation Method O Alternative Excel Calculation Method O Note: If using the Standard Manual Calculation Method make sure all formulas and calculations are included in your word document. If you use the Alternative Excel Calculation Method, you must either submit the excel document with your work or paste the excel work into your word document. See -> Learning Resources -> Showing Math Work. Q1C1. Calculate the sample mean, M. [1 point] Q1C2. Calculate the estimated population standard deviation s\f[13,-5.1 Is the average above the level of college degree? [1 point] CLEAE. Is there a lot of variability in the sample? [1 point] {133. Paste the output table containing the ttest result here. Report the ttest result in svmhols according to the APP. standards, including t statistic with degree of freedom, p value, and effect size d. Present all the items in one single line separated by commas. Paste the Effect Sizes table and highlight the correct effect size to earn the point for effect site 0'. [3 points] 1 each for t statistic, p value, and effect size d. No point is earned if the SPSS table is not pasted here. Deduct 1 point if there is any AFA error [symbols must be italic but numbers are notr all statistics in one single line separated by commas] Must paste effect size table and highlight effect size to earn point for d. Cneck box if SPSS table is :Iasted :I 03-13. Make a decision on the hv pothesis test [13(31. Do we reject or fail to reject the null hypothesis? [1 point] [13:32. Explain 1.iour rationale [what information did vou use to make this decision?:|. [1 point] Extra Credit Opportunity [+2 points Extra Credit] 1. We are conducting a two-tailed hypothesis test, with a = .l- and with a dataset of 15 participants. IdentifyI the critical tvalue[s] from the t table. [+ W Extra Credit] .5 point for each value. 2. E tests and ttests are both parametric statistical test that make assumptions about the population parameters and the distributions that the data came from. In what situation would we use attest as opposed to a Ztest? [+ W Extra Credit] 3. Say we nd that our effect size is small but we have a significant p value. what does this mean about our research ndings? l+,5 point Extra Credit]
Step by Step Solution
There are 3 Steps involved in it
Step: 1
Get Instant Access to Expert-Tailored Solutions
See step-by-step solutions with expert insights and AI powered tools for academic success
Step: 2
Step: 3
Ace Your Homework with AI
Get the answers you need in no time with our AI-driven, step-by-step assistance