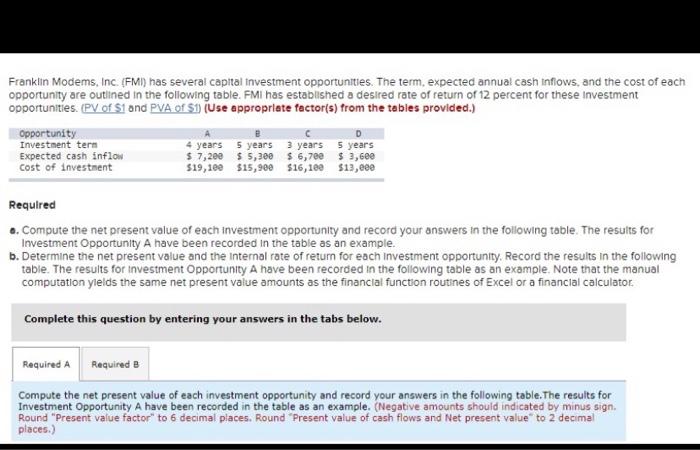
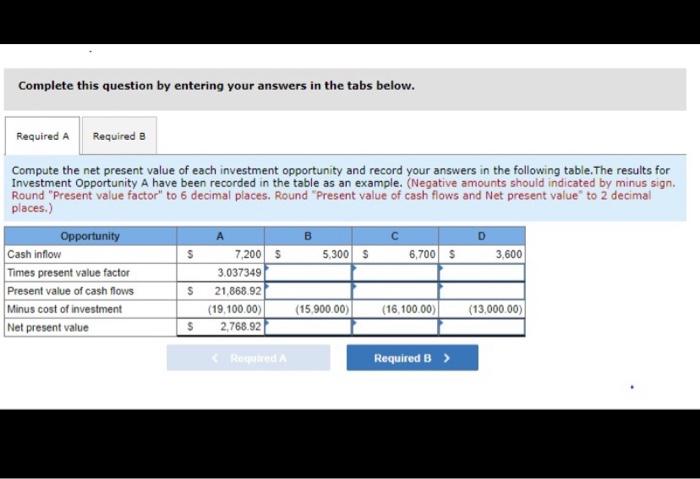
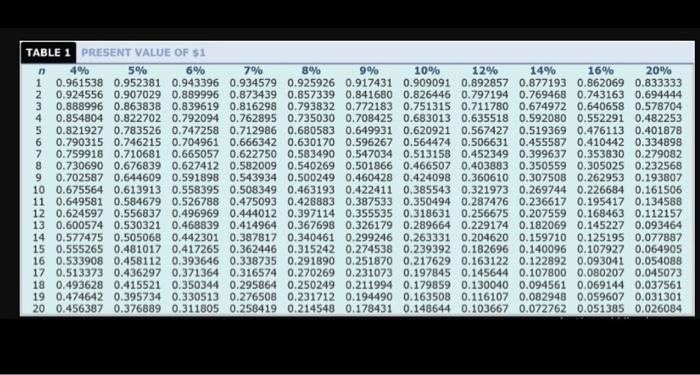
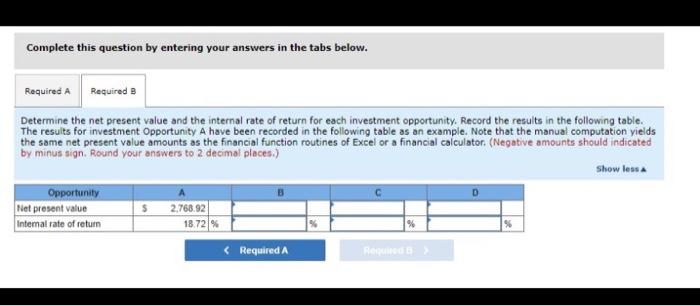
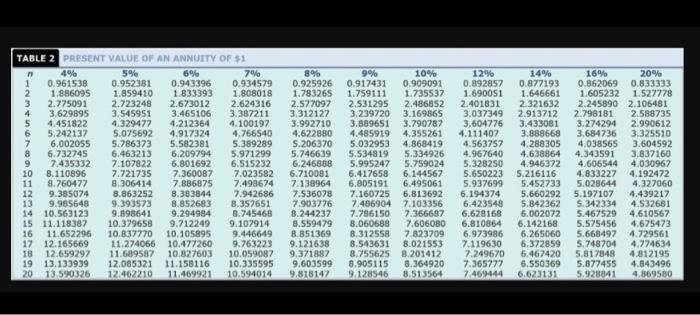
Franklin Modems, Inc. (FMI) has several capital investment opportunities. The term expected annual cash inflows, and the cost of each opportunity are outlined in the following table. FMi has established a desired rate of return of 12 percent for these Investment opportunities. (PV of S1 and PVA of $1 (Use appropriate factor(s) from the tables provided.) Opportunity Investment term Expected cash inflow cost of investment D 4 years 5 years 3 years 5 years $ 7,200 $5,300 $ 6,700 $3,6ee $19,100 $15,900 $16,100 $13, eee Required o. Compute the net present value of each investment opportunity and record your answers in the following table. The results for Investment Opportunity A have been recorded in the table as an example. b. Determine the net present value and the Internal rate of return for each Investment opportunity, Record the results in the following table. The results for investment Opportunity A have been recorded in the following table as an example. Note that the manual computation yields the same net present value amounts as the financial function routines of Excel or a financial calculator Complete this question by entering your answers in the tabs below. Required A Required B Compute the net present value of each investment opportunity and record your answers in the following table. The results for Investment Opportunity A have been recorded in the table as an example. (Negative amounts should indicated by minus sign. Round "Present value factor" to 6 decimal places. Round "Present value of cash flows and Net present value to 2 decimal places.) Complete this question by entering your answers in the tabs below. Required A Required B B D Compute the net present value of each investment opportunity and record your answers in the following table. The results for Investment Opportunity A have been recorded in the table as an example, (Negative amounts should indicated by minus sign. Round "Present value factor" to 6 decimal places. Round "Present value of cash flows and Net present value to 2 decimal places.) Opportunity Cash inflow S 7,200 $ 5.300 $ 6,700 $ 3,600 Times present value factor 3.037349 Present value of cash flows $ 21,868.92 Minus cost of investment (19.100.00) (15,900.00) (16.100.00) (13,000.00) Net present value $ 2,768.92 Roqda Required B > TABLE 1 PRESENT VALUE OF $1 n 4% 5% 6% 7% 8% 9% 10% 12% 14% 16% 20% 1 0.961538 0.952381 0.943396 0.934579 0.925926 0.917431 0.909091 0.892857 0.877193 0.862069 0.833333 2 0.924556 0.907029 0.889996 0.873439 0.857339 0.841680 0.826446 0.797194 0.769468 0.743163 0.694444 3 0.888996 0.863838 0.839619 0.816298 0.793832 0.772183 0.751315 0.711780 0.674972 0.640658 0.578704 4 0.854804 0.822702 0.792094 0.762895 0.735030 0.708425 0.683013 0.635518 0.592080 0.552291 0.482253 5 0.821927 0.783526 0.747258 0.712986 0.680583 0.649931 0.620921 0.567427 0.519369 0.476113 0.401878 6 0.790315 0.746215 0.704961 0.666342 0.630170 0.596267 0.564474 0.506631 0.455587 0.410442 0.334898 7 0.759918 0.710681 0.665057 0.622750 0.583490 0.547034 0.513158 0.452349 0.399637 0.353830 0.279082 8 0.730690 0.676839 0.627412 0.582009 0.540269 0.501866 0.466507 0.403883 0.350559 0.305025 0.232568 9 0.702587 0.644609 0.591898 0.543934 0.500249 0.460428 0.424098 0.360610 0.307508 0.262953 0.193807 10 0.675564 0.613913 0.558395 0.508349 0.463193 0.422411 0.385543 0.321973 0.269744 0.226684 0.161506 11 0.649581 0.584679 0.526788 0.475093 0.428883 0.387533 0.350494 0.287476 0.236617 0.195417 0.134588 12 0.624597 0.556837 0.496969 0.444012 0.397114 0.355535 0.318631 0.256675 0.207559 0.168463 0.112157 13 0.600574 0.530321 0.468839 0.414964 0.367698 0.326179 0.289664 0.229174 0.182069 0.145227 0.093464 14 0.577475 0.505068 0.442301 0.387817 0.340461 0.299246 0.263331 0.204620 0.159710 0.125195 0.077887 15 0.555265 0.481017 0.417265 0.362446 0.315242 0.274538 0.239392 0.182696 0.140096 0.107927 0.064905 16 0.533908 0.458112 0.393646 0.338735 0.291890 0.251870 0.217629 0.163122 0.122892 0.093041 0.054088 17 0.513373 0.436297 0.371364 0.316574 0.270269 0.231073 0.197845 0.145644 0.107800 0.080207 0.045073 18 0.493628 0.415521 0.350344 0.295864 0.250249 0.211994 0.179859 0.130040 0.094561 0.069144 0.037561 19 0.474642 0.395734 0.330513 0.276508 0.231712 0.194490 0.163508 0.116107 0.082948 0.059607 0.031301 20 0.456387 0.376889 0.311805 0.258419 0.214548 0.178431 0.148644 0.103667 0.072762 0.051385 0.026084 Complete this question by entering your answers in the tabs below. Required A Required B Determine the net present value and the internal rate of return for each investment opportunity. Record the results in the following table. The results for investment Opportunity A have been recorded in the following table as an example. Note that the manual computation yields the same net present value amounts as the financial function routines of Excel or a financial calculator. (Negative amounts should indicated by minus sign. Round your answers to 2 decimal places.) Show less Opportunity Net present Value $ 2,768.92 Intemal rate of return 18.72 % %