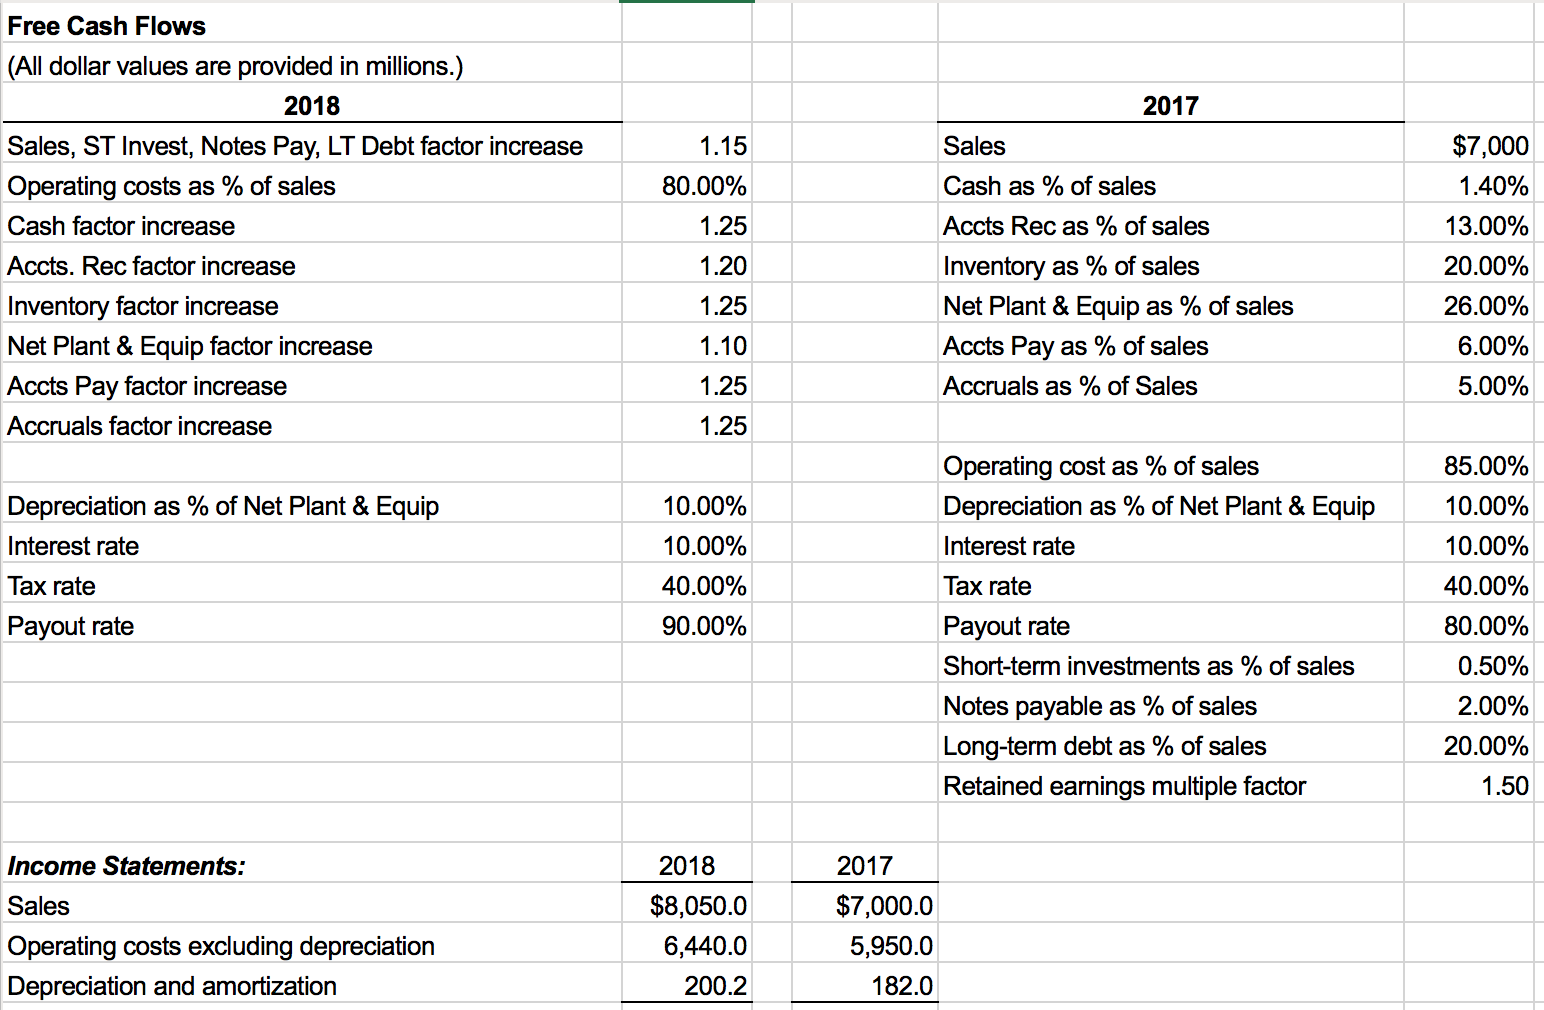
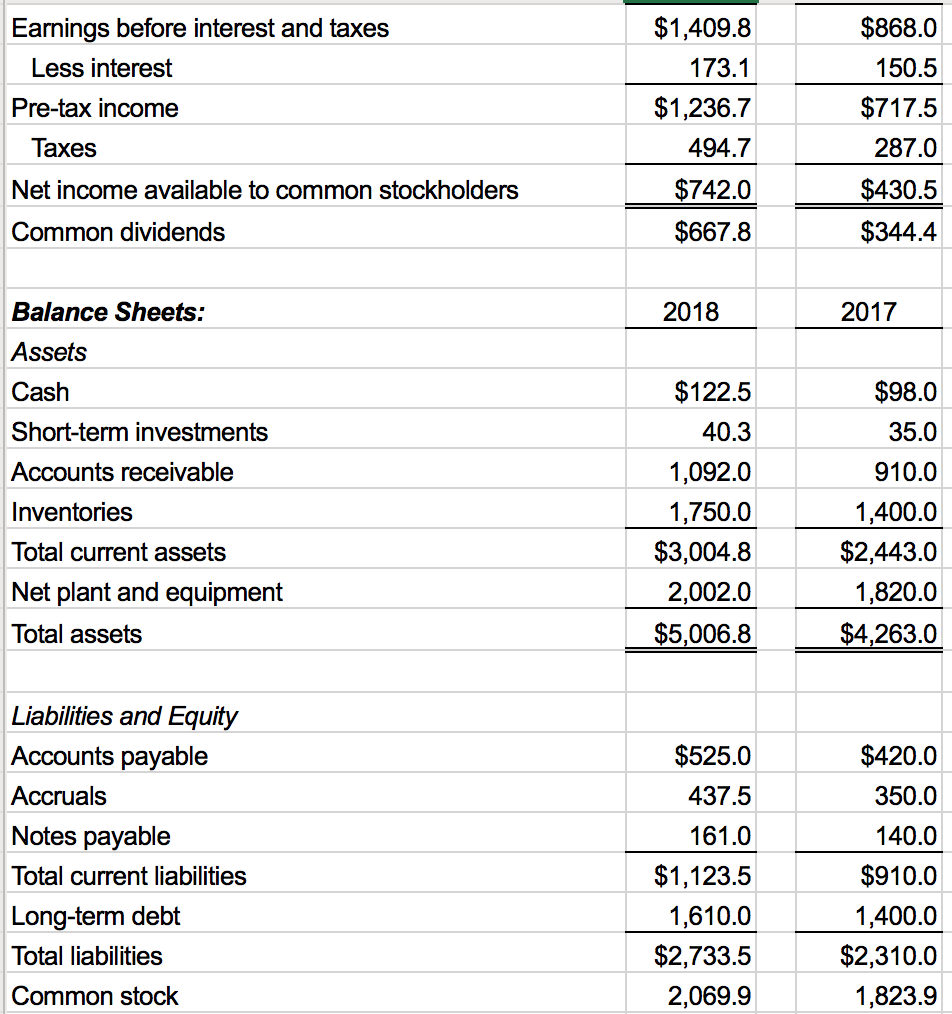
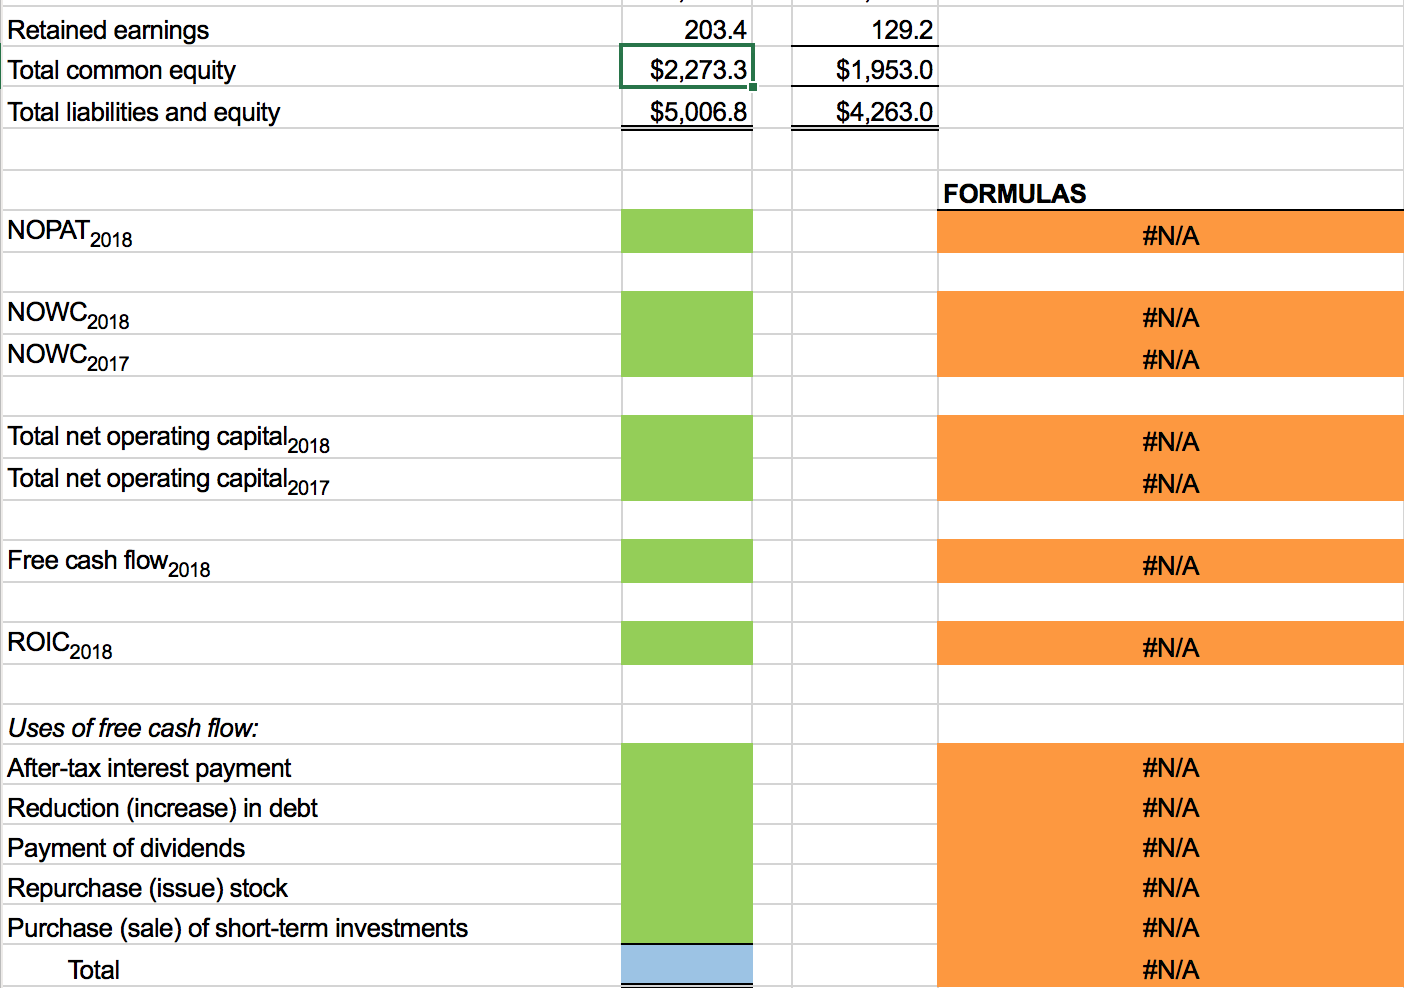
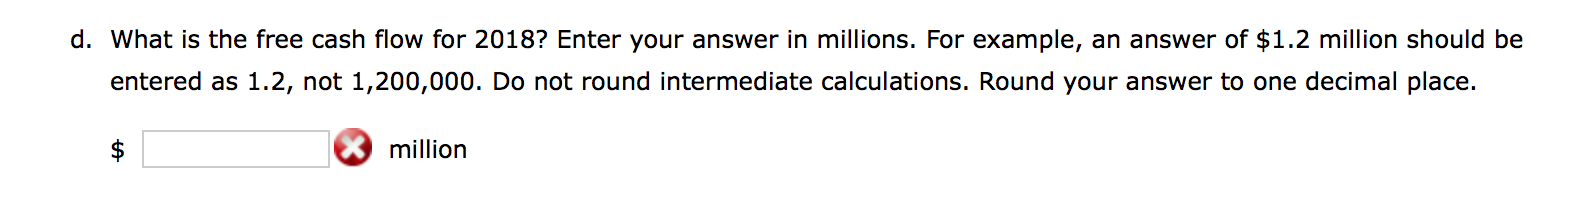
Free Cash Flows (All dollar values are provided in millions.) 2018 Sales, ST Invest, Notes Pay, LT Debt factor increase Operating costs as % of sales Cash factor increase Accts. Rec factor increase Inventory factor increase Net Plant & Equip factor increase Accts Pay factor increase Accruals factor increase 1.15 80.00% 1.25 1.20 1.25 1.10 1.25 1.25 2017 Sales Cash as % of sales Accts Rec as % of sales Inventory as % of sales Net Plant & Equip as % of sales Accts Pay as % of sales Accruals as % of Sales $7,000 1.40% 13.00% 20.00% 26.00% 6.00% 5.00% 85.00% 10.00% Depreciation as % of Net Plant & Equip Interest rate Tax rate 10.00% 10.00% 10.00% 40.00% 90.00% 40.00% Payout rate Operating cost as % of sales Depreciation as % of Net Plant & Equip Interest rate Tax rate Payout rate Short-term investments as % of sales Notes payable as % of sales Long-term debt as % of sales Retained earnings multiple factor 80.00% 0.50% 2.00% 20.00% 1.50 2018 2017 Income Statements: Sales Operating costs excluding depreciation Depreciation and amortization $8,050.0 6.440.0 200.2 $7,000.0 5,950.0 182.0 $868.0 150.5 Earnings before interest and taxes Less interest Pre-tax income Taxes Net income available to common stockholders Common dividends $1,409.8 173.1 $1,236.7 494.7 $742.0 $667.8 $717.5 287.0 $430.5 $344.4 2018 2017 Balance Sheets: Assets Cash Short-term investments Accounts receivable Inventories Total current assets Net plant and equipment Total assets $122.5 40.3 1,092.0 1,750.0 $3,004.8 2,002.0 $5.006.8 $98.0 35.0 910.0 1,400.0 $2,443.0 1,820.0 $4,263.0 $525.0 Liabilities and Equity Accounts payable Accruals Notes payable Total current liabilities Long-term debt Total liabilities 437.5 161.0 $1,123.5 1,610.0 $2,733.5 2,069.9 $420.0 350.0 140.0 $910.0 1.400.0 $2,310.0 1,823.9 Common stock Retained earnings Total common equity Total liabilities and equity 203.4 $2,273.3 $5,006.8 129.2 $1,953.0 $4,263.0 FORMULAS NOPAT 2018 #N/A NOWC2018 NOWC2017 #N/A #N/A #NA Total net operating capital 2018 Total net operating capital 2017 #N/A Free cash flow 2018 #N/A ROIC2018 #N/A #NA #N/A Uses of free cash flow: After-tax interest payment Reduction (increase) in debt Payment of dividends Repurchase (issue) stock Purchase (sale) of short-term investments Total #N/A #N/A #N/A #N/A d. What is the free cash flow for 2018? Enter your answer in millions. For example, an answer of $1.2 million should be entered as 1.2, not 1,200,000. Do not round intermediate calculations. Round your answer to one decimal place. HA million million Free Cash Flows (All dollar values are provided in millions.) 2018 Sales, ST Invest, Notes Pay, LT Debt factor increase Operating costs as % of sales Cash factor increase Accts. Rec factor increase Inventory factor increase Net Plant & Equip factor increase Accts Pay factor increase Accruals factor increase 1.15 80.00% 1.25 1.20 1.25 1.10 1.25 1.25 2017 Sales Cash as % of sales Accts Rec as % of sales Inventory as % of sales Net Plant & Equip as % of sales Accts Pay as % of sales Accruals as % of Sales $7,000 1.40% 13.00% 20.00% 26.00% 6.00% 5.00% 85.00% 10.00% Depreciation as % of Net Plant & Equip Interest rate Tax rate 10.00% 10.00% 10.00% 40.00% 90.00% 40.00% Payout rate Operating cost as % of sales Depreciation as % of Net Plant & Equip Interest rate Tax rate Payout rate Short-term investments as % of sales Notes payable as % of sales Long-term debt as % of sales Retained earnings multiple factor 80.00% 0.50% 2.00% 20.00% 1.50 2018 2017 Income Statements: Sales Operating costs excluding depreciation Depreciation and amortization $8,050.0 6.440.0 200.2 $7,000.0 5,950.0 182.0 $868.0 150.5 Earnings before interest and taxes Less interest Pre-tax income Taxes Net income available to common stockholders Common dividends $1,409.8 173.1 $1,236.7 494.7 $742.0 $667.8 $717.5 287.0 $430.5 $344.4 2018 2017 Balance Sheets: Assets Cash Short-term investments Accounts receivable Inventories Total current assets Net plant and equipment Total assets $122.5 40.3 1,092.0 1,750.0 $3,004.8 2,002.0 $5.006.8 $98.0 35.0 910.0 1,400.0 $2,443.0 1,820.0 $4,263.0 $525.0 Liabilities and Equity Accounts payable Accruals Notes payable Total current liabilities Long-term debt Total liabilities 437.5 161.0 $1,123.5 1,610.0 $2,733.5 2,069.9 $420.0 350.0 140.0 $910.0 1.400.0 $2,310.0 1,823.9 Common stock Retained earnings Total common equity Total liabilities and equity 203.4 $2,273.3 $5,006.8 129.2 $1,953.0 $4,263.0 FORMULAS NOPAT 2018 #N/A NOWC2018 NOWC2017 #N/A #N/A #NA Total net operating capital 2018 Total net operating capital 2017 #N/A Free cash flow 2018 #N/A ROIC2018 #N/A #NA #N/A Uses of free cash flow: After-tax interest payment Reduction (increase) in debt Payment of dividends Repurchase (issue) stock Purchase (sale) of short-term investments Total #N/A #N/A #N/A #N/A d. What is the free cash flow for 2018? Enter your answer in millions. For example, an answer of $1.2 million should be entered as 1.2, not 1,200,000. Do not round intermediate calculations. Round your answer to one decimal place. HA million million