

Answered step by step
Verified Expert Solution
Question
1 Approved Answer
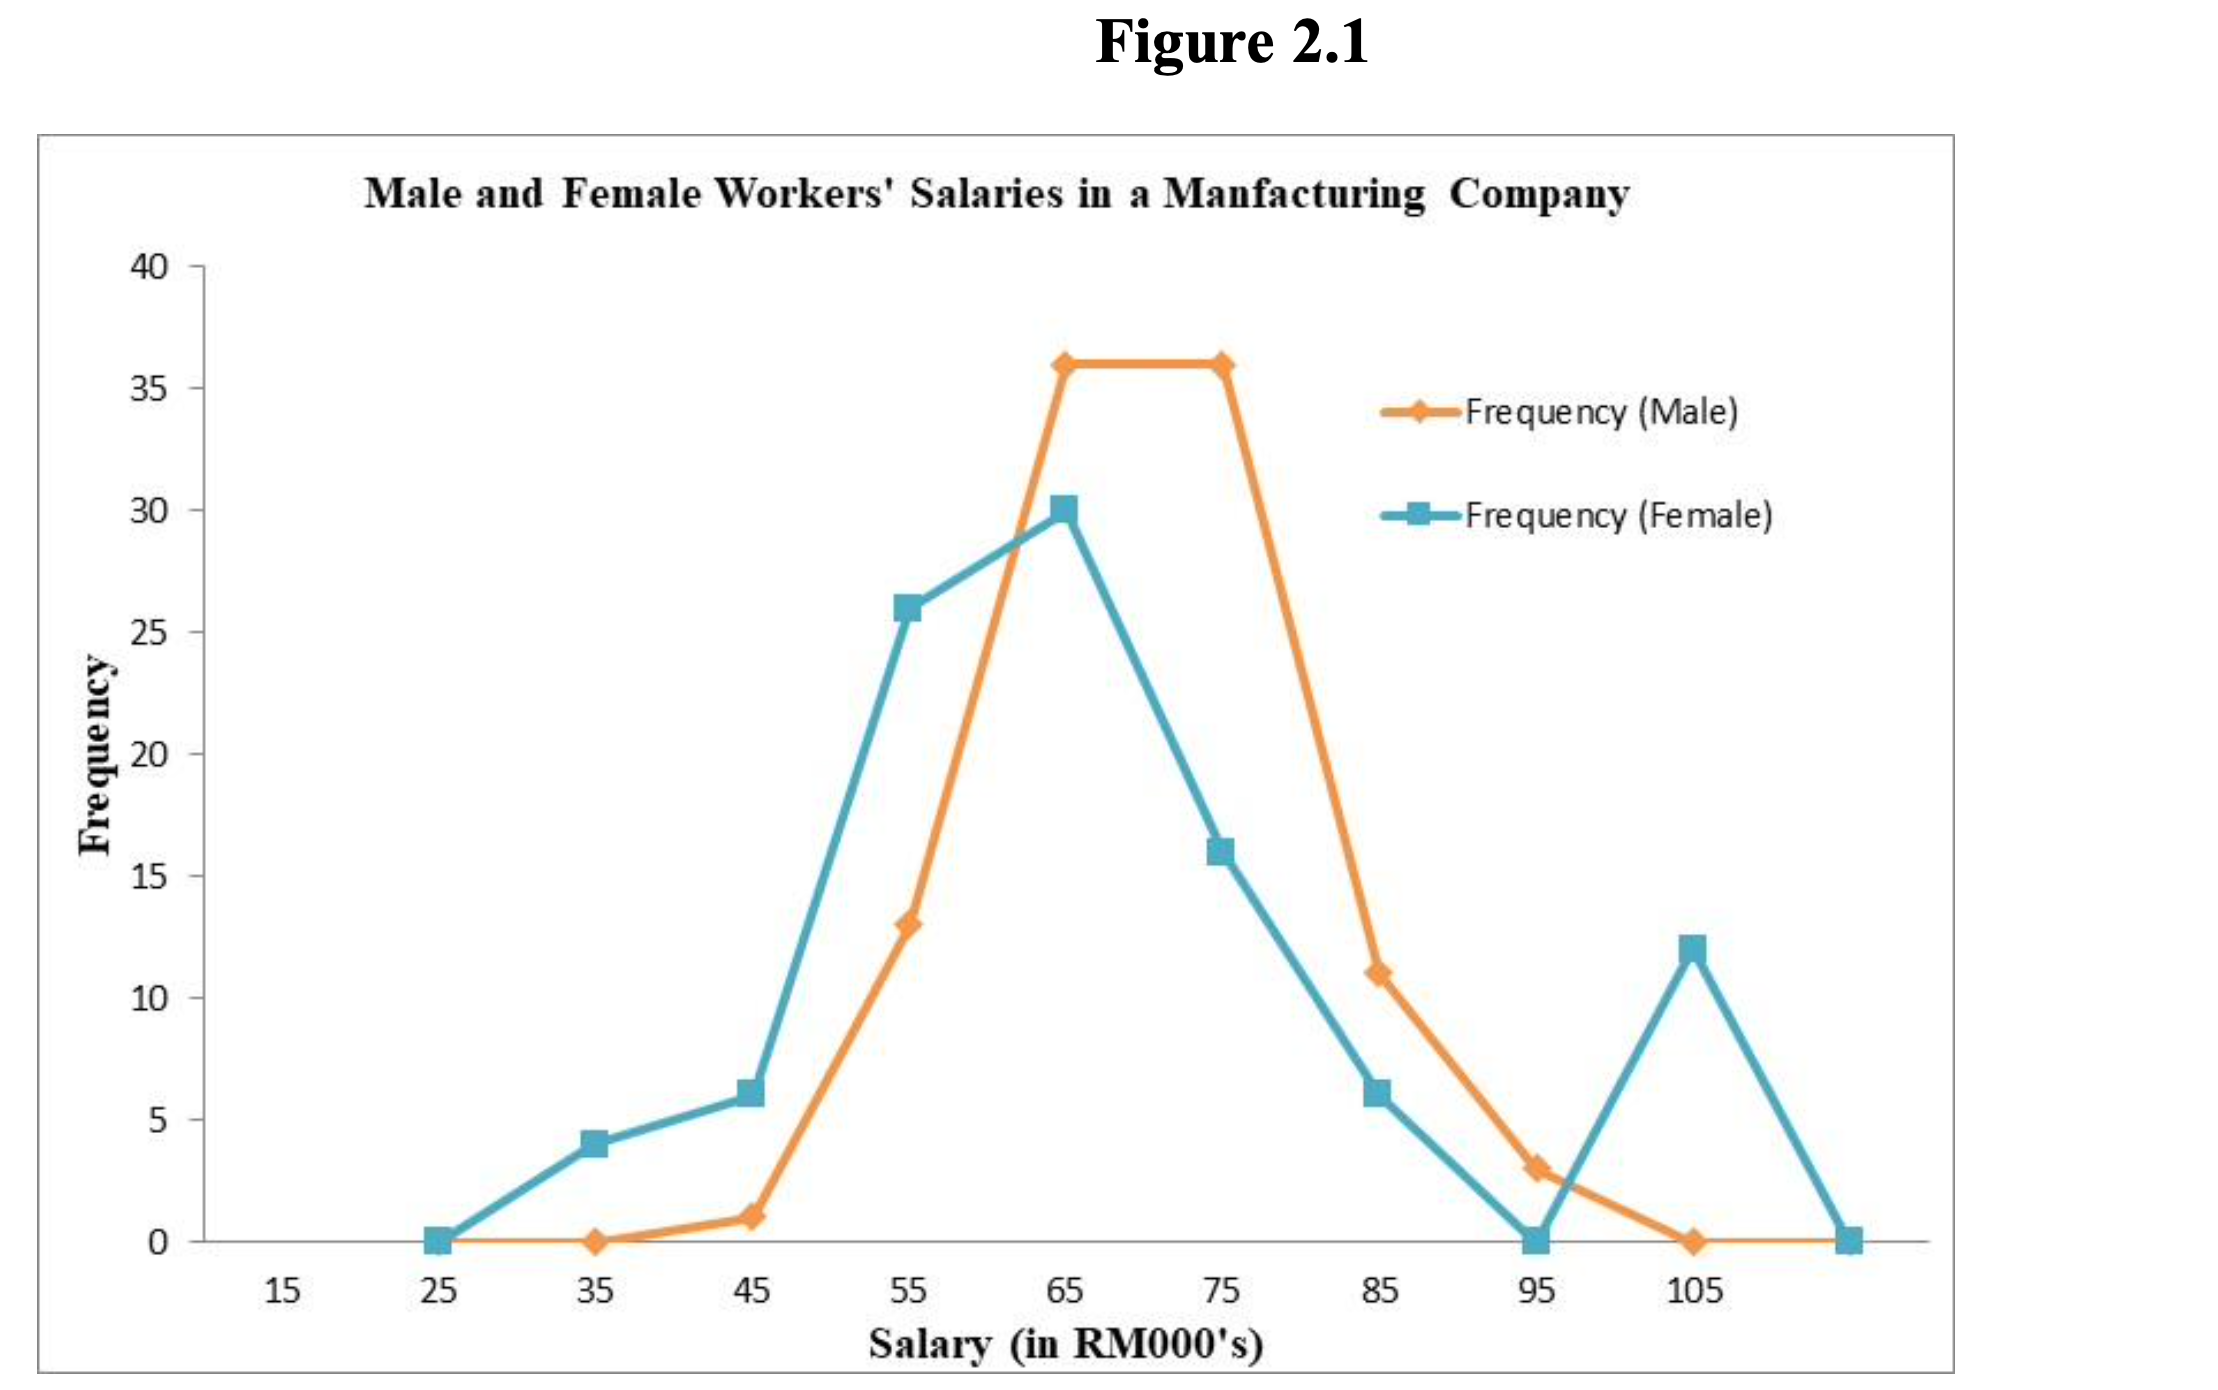
Frequency polygons for male and female workers' salaries are provided in Figure 2.1. Figure 2.1 Male and Female Workers' Salaries in a Manfacturing Company 40
Frequency polygons for male and female workers' salaries are provided in Figure 2.1.
Step by Step Solution
There are 3 Steps involved in it
Step: 1

Get Instant Access to Expert-Tailored Solutions
See step-by-step solutions with expert insights and AI powered tools for academic success
Step: 2

Step: 3
Ace Your Homework with AI
Get the answers you need in no time with our AI-driven, step-by-step assistance
Get Started
Probability and Stochastic Processes A Friendly Introduction for Electrical and Computer Engineers
Authors: Roy D. Yates, David J. Goodman
3rd edition
1118324560, 978-1118324561