From Caltex australia 2018 and 2019 financial statements, list each item of equity reported and write your understanding of each item. Discuss any changes in each item of equity for your company over last two years articulating the reasons for the change.
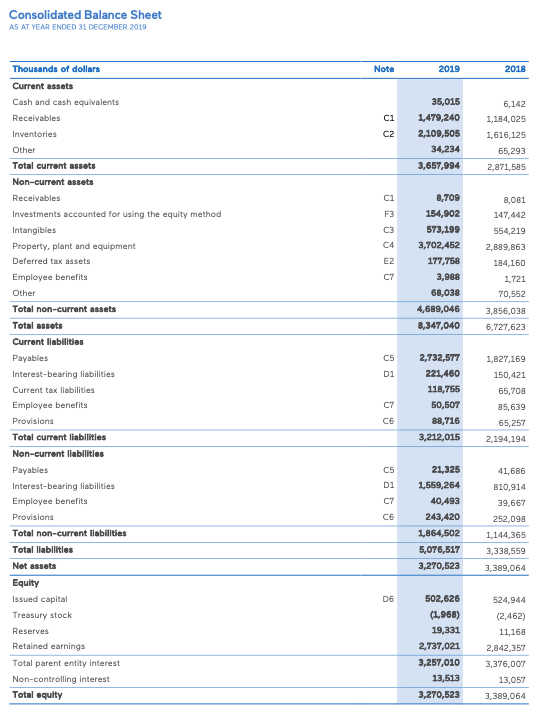
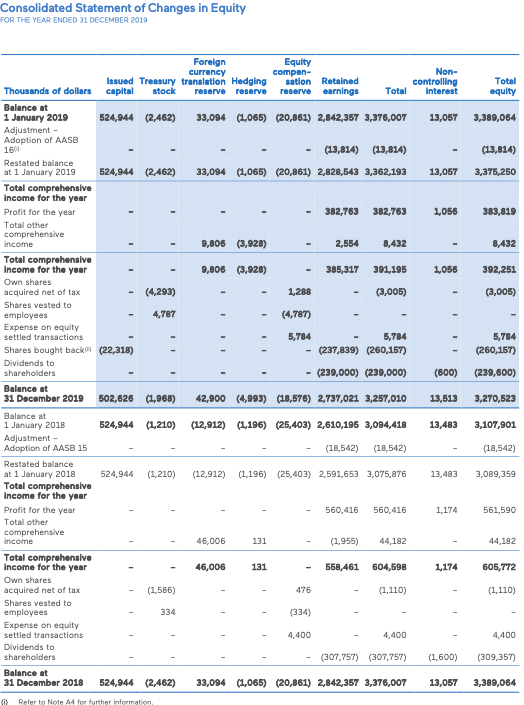
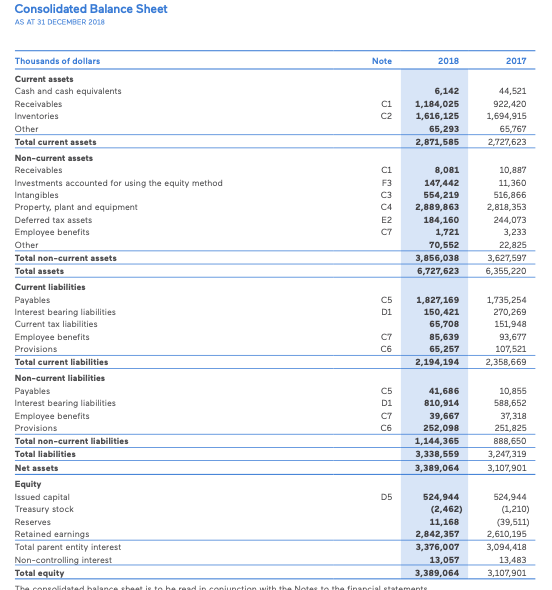
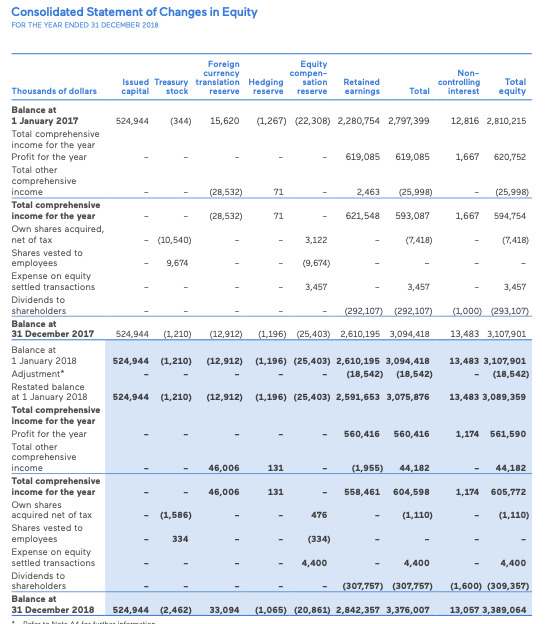
Consolidated Balance Sheet AS AT YEAR ENDED 31 DECEMBER 2019 Nota 2019 2018 C1 35,015 1,479,240 2,109,505 34,234 C2 6,142 1,184,025 1,616,125 65,293 2,871,585 3,657,994 C1 F3 C3 C4 E2 8,709 154,902 573,199 3,702,452 177,758 3,988 68,038 4,689,046 8,347,040 8,081 147,442 554,219 2,889,863 184,160 1,721 70,552 3,856,038 6,727,623 C7 Di Thousands of dollars Current assets Cash and cash equivalents Receivables Inventories Other Total current assets Non-current assets Receivables Investments accounted for using the equity method Intangibles Property, plant and equipment Deferred tax assets Employee benefits Other Total non-current assets Total assets Current liabilities Payables Interest-bearing liabilities Current tax liabilities Employee benefits Provisions Total current liabilities Non-current liabilities Payables Interest-bearing liabilities Employee benefits Provisions Total non-current liabilities Total liabilities Net assets Equity Issued capital Treasury stock Reserves Retained earnings Total parent entity interest Non-controlling interest Total aquity 1,827,169 150,421 65,708 2,732,577 221,460 118,755 50,507 88,716 3,212,015 C7 C6 85,639 65,257 2,194,194 C5 41.686 810,914 Di C7 C6 21,325 1,559,264 40,493 243,420 1,864,502 5,076,517 3,270,523 39,667 252,098 1,144,365 3,338,559 3,389,064 D6 502,626 (1,968) 19,331 2,737,021 3,257,010 13,513 3,270,523 524,944 (2.462) 11,168 2,842,357 3,376,007 13,057 3,389,064 Consolidated Statement of Changes in Equity FOR THE YEAR ENDED 31 DECEMBER 2019 Non- controlling interest Total equity 13,057 3,389,064 (13,814) 13,057 3,375,250 1,056 383,819 8,432 1,056 392,251 (3,005) 5,784 (260,157) Foreign Equity currency compen- Issued Treasury translation Hedging sation Retained Thousands of dollars capital stock reserve reserve reserve earnings Total Balance at 1 January 2019 524,944 (2,462) 33,094 (1,065) (20,861) 2,042,357 3,376,007 Adjustment - Adoption of AASB 1601 (13,814) (13,814) Restated balance at 1 January 2019 524,944 (2.462) 33,094 (1,065) (20,861) 2,828,543 3,362,193 Total comprehensive income for the year Profit for the year 382,763 382,763 Total other comprehensive income 9,808 (3,928) 2,554 8,432 Total comprehensive income for the year 9,806 (3,928) 385,317 391,195 Own shares acquired net of tax (4,293) 1,288 (3,005) Shares vested to employees 4,787 (4.787) Expense on equity settled transactions 5,784 5,784 Shares bought backo (22,318) - (237,839) (260,157) Dividends to shareholders - (239,000) (239,000) Balance at 31 December 2019 502,626 (1,968) 42,900 (4,993) (18,576) 2,737,021 3,257,010 Balance at 1 January 2018 524,944 (1,210) (12,912) (1,196) (25,403) 2,610,195 3,094,418 Adjustment - Adoption of AASB 15 (18,542) (18,542) Restated balance at 1 January 2018 524,944 (1,210) (12,912) (1,196) (25,403) 2,591,653 3,075,876 Total comprehensive Income for the year Profit for the year 560,416 560,416 Total other comprehensive income 46,006 131 (1955) 44,182 Total comprehensive income for the year 46,006 131 558,461 604,598 Own shares acquired net of tax (1586) 476 (1.110) Shares vested to employees 334 (334) Expense on equity settled transactions 4,400 4,400 Dividends to shareholders (307,757) (307,757) Balance at 31 December 2018 524,944 (2.462) 33,094 (1,065) (20,861) 2,842,357 3,376,007 (600) (239,600) 13,513 3,270,523 13,483 3,107,901 (18,542) 13,483 3,089,359 1,174 561,590 44,182 1,174 605,772 (1,110) 4,400 (1,600) (309,357) 13,057 3,389,064 (0) Refer to Note A4 for further information Consolidated Balance Sheet AS AT 31 DECEMBER 2018 Note 2018 2017 C1 C2 6,142 1,184,025 1,616,125 65,293 2,871,585 44,521 922,420 1,694,915 65,767 2,727,623 C1 F3 C3 C4 E2 C7 8,081 147,442 554,219 2,889,863 184,160 1,721 70,552 3,856,038 6,727,623 10,887 11,360 516,866 2,818,353 244,073 3,233 22,825 3,627,597 6,355,220 D1 Thousands of dollars Current assets Cash and cash equivalents Receivables Inventories Other Total current assets Non-current assets Receivables Investments accounted for using the equity method Intangibles Property, plant and equipment Deferred tax assets Employee benefits Other Total non-current assets Total assets Current liabilities Payables Interest bearing liabilities Current tax liabilities Employee benefits Provisions Total current liabilities Non-current liabilities Payables Interest bearing liabilities Employee benefits Provisions Total non-current liabilities Total liabilities Net assets Equity Issued capital Treasury stock Reserves Retained earnings Total parent entity interest Non-controlling interest Total equity C7 C6 1,827,169 150,421 65,708 85,639 65,257 2,194,194 1,735,254 270,269 151,948 93,677 107,521 2,358,669 Di C7 C6 41,686 810,914 39,667 252,098 1,144,365 3,338,559 3,389,064 10,855 588,652 37,318 251,825 888,650 3,247,319 3,107,901 D5 524,944 (2,462) 11,168 2,842,357 3,376,007 13,057 3,389,064 524,944 (1,210) (39,511) 2,610,195 3,094,418 13,483 3,107,901 Thota halabaleta in netin with the Netha Financial stamante Consolidated Statement of Changes in Equity FOR THE YEAR ENDED 31 DECEMBER 2018 Foreign currency Issued Treasury translation Hedging capital stock reserve reserve Equity compen- sation reserve Non- controlling interest Retained earnings Thousands of dollars Total Total equity 524,944 (344) 15,620 (1,267) (22,308) 2,280,754 2,797,399 12,816 2,810,215 619,085 619,085 1,667 620,752 (28,532) 71 2,463 (25,998) (25,998) (28,532) 71 621,548 593,087 1,667 594,754 (10,540) 3,122 (7,418) (7,418) 9,674 (9,674) 3,457 3,457 3,457 (292,107) (292,107) (1,000) (293,107) 524,944 (1,210) (12,912) (1,196) (25,403) 2,610,195 3,094,418 13,483 3,107,901 Balance at 1 January 2017 Total comprehensive income for the year Profit for the year Total other comprehensive income Total comprehensive income for the year Own shares acquired, net of tax Shares vested to employees Expense on equity settled transactions Dividends to shareholders Balance at 31 December 2017 Balance at 1 January 2018 Adjustment Restated balance at 1 January 2018 Total comprehensive income for the year Profit for the year Total other comprehensive income Total comprehensive income for the year Own shares acquired net of tax Shares vested to employees Expense on equity settled transactions Dividends to shareholders Balance at 31 December 2018 524,944 (1,210) (12,912) (1,196) (25,403) 2,610,195 3,094,418 (18,542) (18,542) 13,483 3,107,901 (18,542) 524,944 (1,210) (12,912) (1,196) (25,403) 2,591,653 3,075,876 13,483 3,089,359 560,416 560,416 1,174 561,590 46,006 131 (1,955) 44,182 44,182 46,006 131 558,461 604,598 1,174 605,772 (1,586) 476 (1,110) (1,110) 334 (334) 4,400 4,400 4,400 (307,757) (307,757) (1,600) (309,357) 524,944 (2,462) 33,094 (1,065) (20,861) 2.842,357 3,376,007 13,057 3,389,064


