

Answered step by step
Verified Expert Solution
Question
1 Approved Answer
From real calculus, you should know the derivative ofrx)-xisf(x)-2x. So at x = 300, the exact value of the derivative f(300) is obviously 600 However,
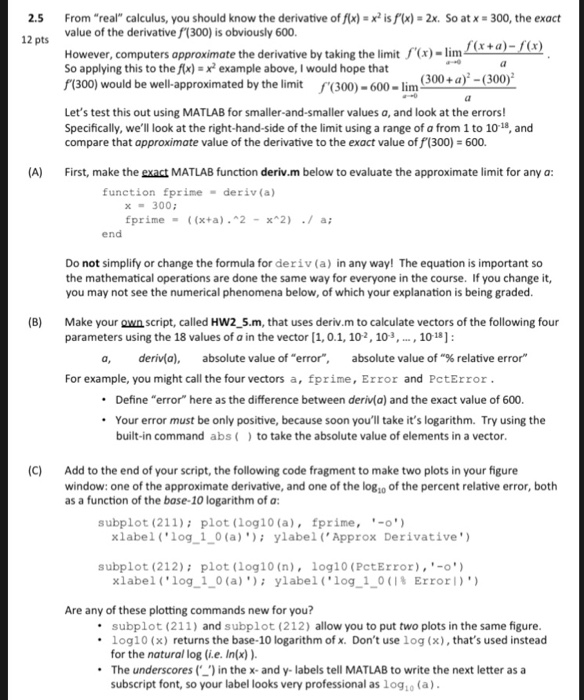
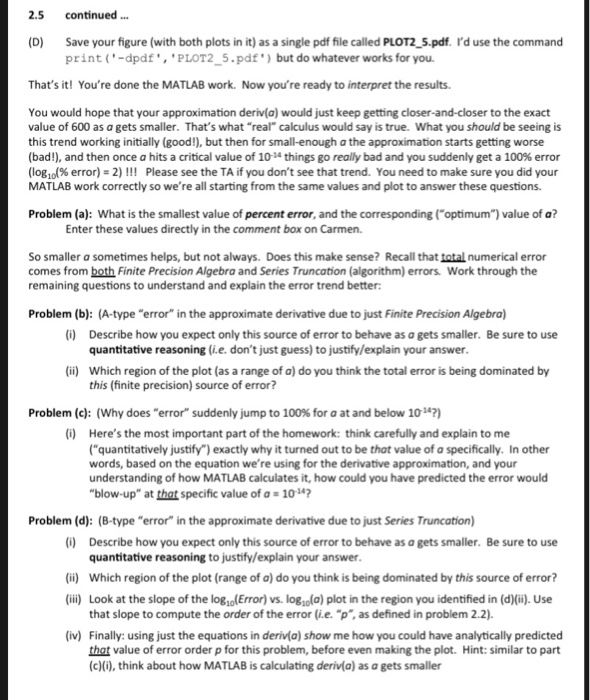
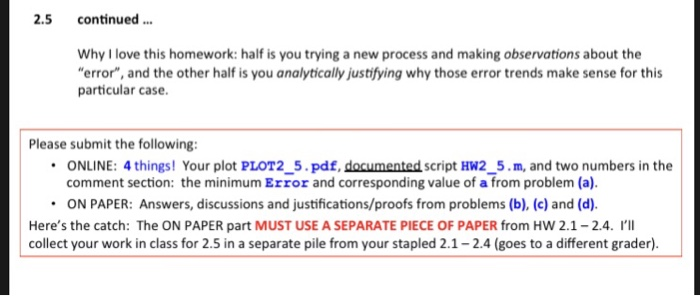 From real" calculus, you should know the derivative ofrx)-xisf(x)-2x. So at x = 300, the exact value of the derivative f(300) is obviously 600 However, computers approximate the derivative by taking the limit f(x)-lim So applying this to thefx)xexample above, I would hope that f(300) would be well-approximated by the limit (300)-600-lim (300 + ar-(300)- 2.5 12 pts Let's test this out using MATLAB for smaller-and-smaller values a, and look at the errors! Specifically, we'll look at the right-hand-side of the limit using a range of a from 1 to 1018, and compare that approximate value of the derivative to the exact value of f(300) 600. (A) First, make the exact MATLAB function deriv.m below to evaluate the approximate limit for any a: function fprime deriv(a) x300; end Do not simplify or change the formula for deriv(a) in any way! The equation is important so the mathematical operations are done the same way for everyone in the course. If you change it, you may not see the numerical phenomena below, of which your explanation is being graded (B) Make your own script, called HW2 5.m, that uses deriv.m to calculate vectors of the following four parameters using the 18 values of a in the vector [1, 0.1, 102, 103, , 10181: a, deriv(a), absolute value of "error", absolute value of "% relative error" For example, you might call the four vectors a, fprime, Error and PctError Define "error" here as the difference between deriv a) and the exact value of 600 Your error must be only positive, because soon you'll take it's logarithm. Try using the built-in command absto take the absolute value of elements in a vector. (C) Add to the end of your script, the following code fragment to make two plots in your figure window: one of the approximate derivative, and one of the log o of the percent relative error, both as a function of the base-10 logarithm of a: subplot (211) plot (log10 (a), fprime, '-o') xlabel ('1og 1 0 (a)ylabel('Approx Derivative') subplot (212) plot (log10 (n), log10 (PctError),-' x label ( ' log-1-0 (a)' ) ; ylabel ( * log-1.0 ( 1 % Error I ) * ) Are any of these plotting commands new for you? subplot (211) and subplot (212) allow you to put two plots in the same figure log10 (x) returns the base-10 logarithm of x. Don't use log (x), that's used instead for the natural log (ie. In(x)) The underscores ( in the x-and y- labels tell MATLAB to write the next letter as a subscript font, so your label looks very professional as log1o (a) 2.5 continued. (D) Save your figure (with both plots in it) as a single pdf file called PLOT2 5.pdf. I'd use the command print(-dpdf,'PLOT2 5.pdf') but do whatever works for you That's it! You're done the MATLAB work. Now you're ready to interpret the results. You would hope that your approximation deriv(a) would just keep getting closer-and-closer to the exact value of 600 as a gets smaller. That's what "real" calculus would say is true. What you should be seeing is this trend working initially (good!), but then for small-enough a the approximation starts getting worse (bad!), and then once a hits a critical value of 1014 things go really bad and you suddenly get a 100% error (log10(96 error)-2) ! !! Please see the TA if you don't see that trend. You need to make sure you did your MATLAB work correctly so we're all starting from the same values and plot to answer these questions Problem (a): What is the smallest value of percent error, and the corresponding ("optimum") value of a? Enter these values directly in the comment box on Carmen. So smaller sometimes helps, but not always. Does this make sense? Recall that total numerical error comes from both Finite Precision Algebra and Series Truncation (algorithm) errors. Work through the remaining questions to understand and explain the error trend better: Problem (b): (A-type "error" in the approximate derivative due to just Finite Precision Algebra) (i) Describe how you expect only this source of error to behave as a gets smaller. Be sure to use quantitative reasoning (i.e. don't just guess) to justify/explain your answer Which region of the plot (as a range of a) do you think the total error is being dominated by this (finite precision) source of error? (ii) Problem (c): (Why does "error" suddenly jump to 100% for a at and below 1014?) (i) Here's the most important part of the homework: think carefully and explain to me "quantitatively justify) exactly why it turned out to be that value of a specifically. In other words, based on the equation we're using for the derivative approximation, and your understanding of how MATLAB calculates it, how could you have predicted the error would blow-up" at that specific value of a 10 Problem (d): (B-type "error" in the approximate derivative due to just Series Truncation) ()Describe how you expect only this source of error to behave as a gets smaller. Be sure to use quantitative reasoning to justify/explain your answer (ii) Which region of the plot (range of a) do you think is being dominated by this source of error? (ii)Look at the slope of the log10(Error) vs. logo(a) plot in the region you identified in (d)(). Use that slope to compute the order of the error (i.e. "p,as defined in problem 2.2) v) Finally: using just the equations in deriv(a) show me how you could have analytically predicted that value of error order p for this problem, before even making the plot. (c)(), think about how MATLAB is calculating deriv(a) as a gets smaller Hint: similar to part 2.5 continued Why I love this homework: half is you trying a new process and making observations about the error", and the other half is you analytically justifying why those error trends make sense for this particular case Please submit the following: ONLINE: 4 things! Your plot PLOT2-5 . pdf, documented script HM2-5 . m, and two numbers in the comment section: the minimum Error and corresponding value of a from problem (a) ON PAPER: Answers, discussions and justifications/proofs from problems (b), (c) and (d). Here's the catch: The ON PAPER part MUST USE A SEPARATE PIECE OF PAPER from HW 2.1-2.4. 'lI collect your work in class for 2.5 in a separate pile from your stapled 2.1-2.4 (goes to a different grader)
Step by Step Solution
There are 3 Steps involved in it
Step: 1

Get Instant Access to Expert-Tailored Solutions
See step-by-step solutions with expert insights and AI powered tools for academic success
Step: 2

Step: 3
Ace Your Homework with AI
Get the answers you need in no time with our AI-driven, step-by-step assistance
Get Started
Excel As Your Database
Authors: Paul Cornell
1st Edition
1590597516, 978-1590597514