

Answered step by step
Verified Expert Solution
Question
1 Approved Answer
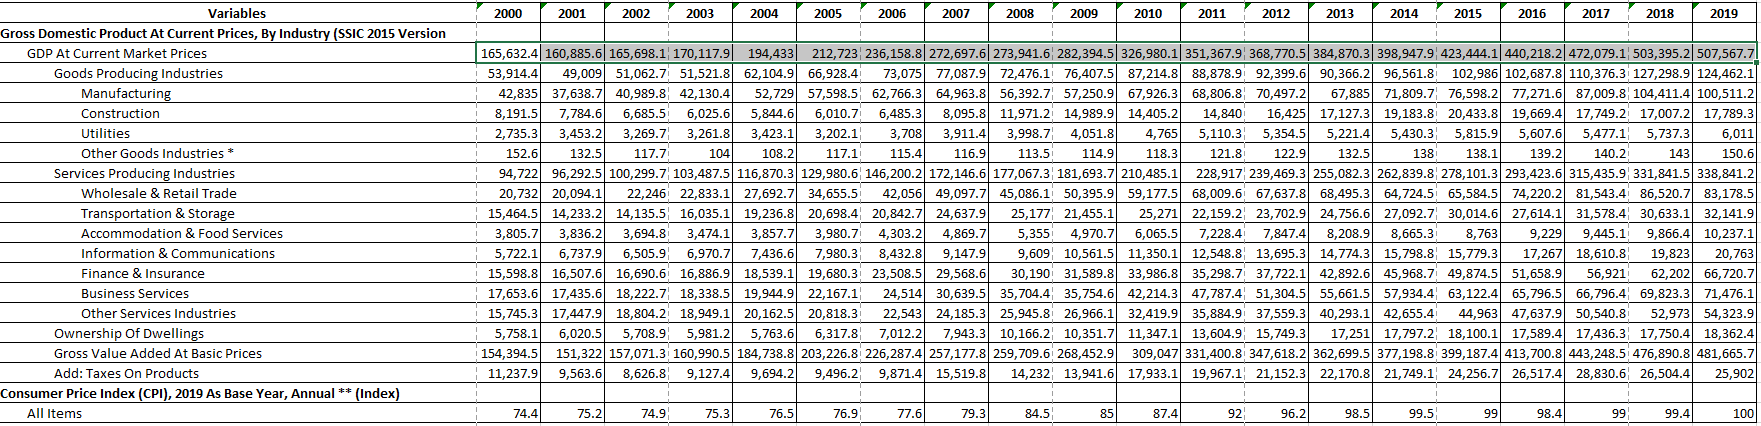
From the data attached below. How would I plot a graph to show the RGDP and inflation rate over the period 2000-2019 in excel?
From the data attached below. How would I plot a graph to show the RGDP and inflation rate over the period 2000-2019 in excel?
Step by Step Solution
There are 3 Steps involved in it
Step: 1

Get Instant Access to Expert-Tailored Solutions
See step-by-step solutions with expert insights and AI powered tools for academic success
Step: 2

Step: 3
Ace Your Homework with AI
Get the answers you need in no time with our AI-driven, step-by-step assistance
Get Started
A Textbook Of Mathematical Economics
Authors: Dr Chandrakant Singh
1st Edition
9353140986, 9789353140984