

Question
From the data below for Apple (AAPL) stock, calculate the upper and lower Bollinger bands, which represent plus (or minus) two standard deviations of the
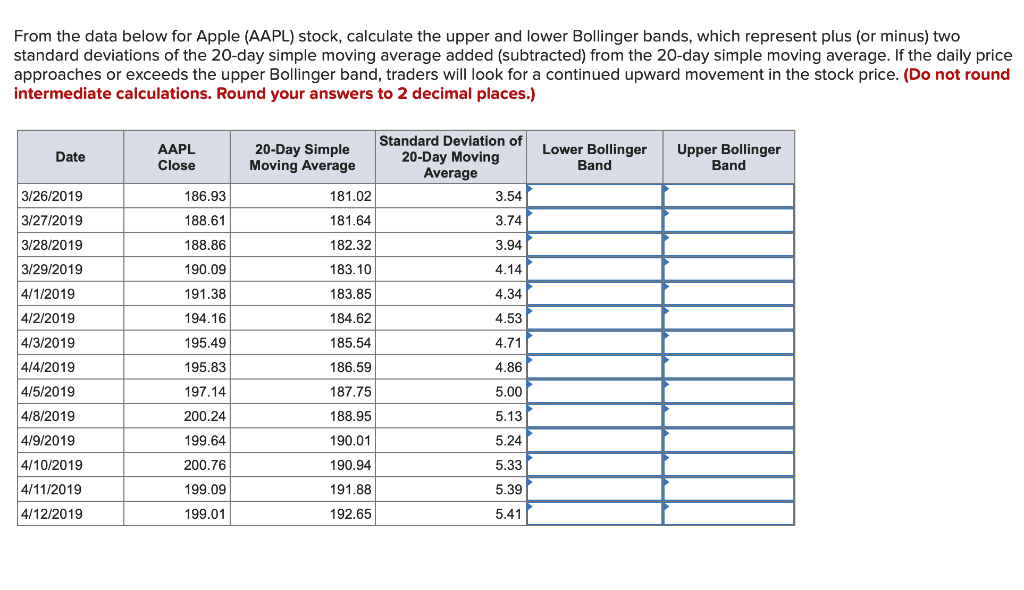
From the data below for Apple (AAPL) stock, calculate the upper and lower Bollinger bands, which represent plus (or minus) two standard deviations of the 20-day simple moving average added (subtracted) from the 20-day simple moving average. If the daily price approaches or exceeds the upper Bollinger band, traders will look for a continued upward movement in the stock price. (Do not round intermediate calculations. Round your answers to 2 decimal places.)
Step by Step Solution
There are 3 Steps involved in it
Step: 1

Get Instant Access to Expert-Tailored Solutions
See step-by-step solutions with expert insights and AI powered tools for academic success
Step: 2

Step: 3
Ace Your Homework with AI
Get the answers you need in no time with our AI-driven, step-by-step assistance
Get Started
Cryptocurrencies And The Energy Transition Challenges And Opportunities For A More Sustainable Economy
Authors: George Elias
1st Edition
B0C1J3FC7R, 979-8389404076