Question
The included spreadsheet titled Assignment2Data.xlsx contains data on the costs for a sample of small agri-businesses in Kansas. Use it to answer the following questions.
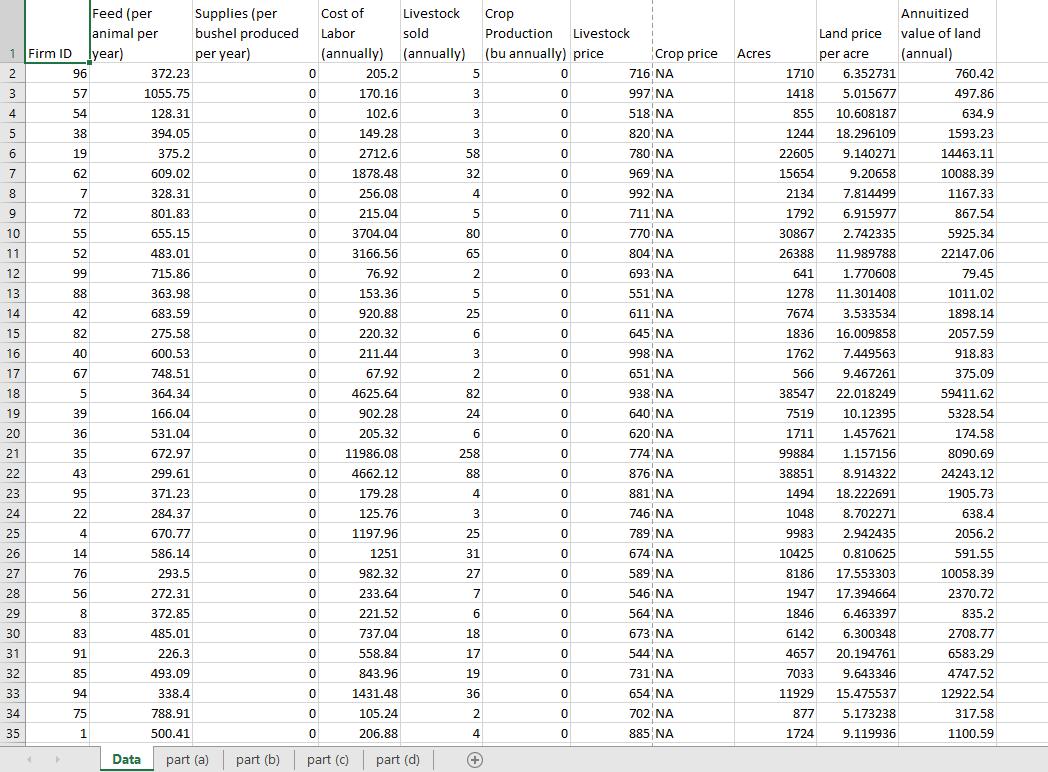
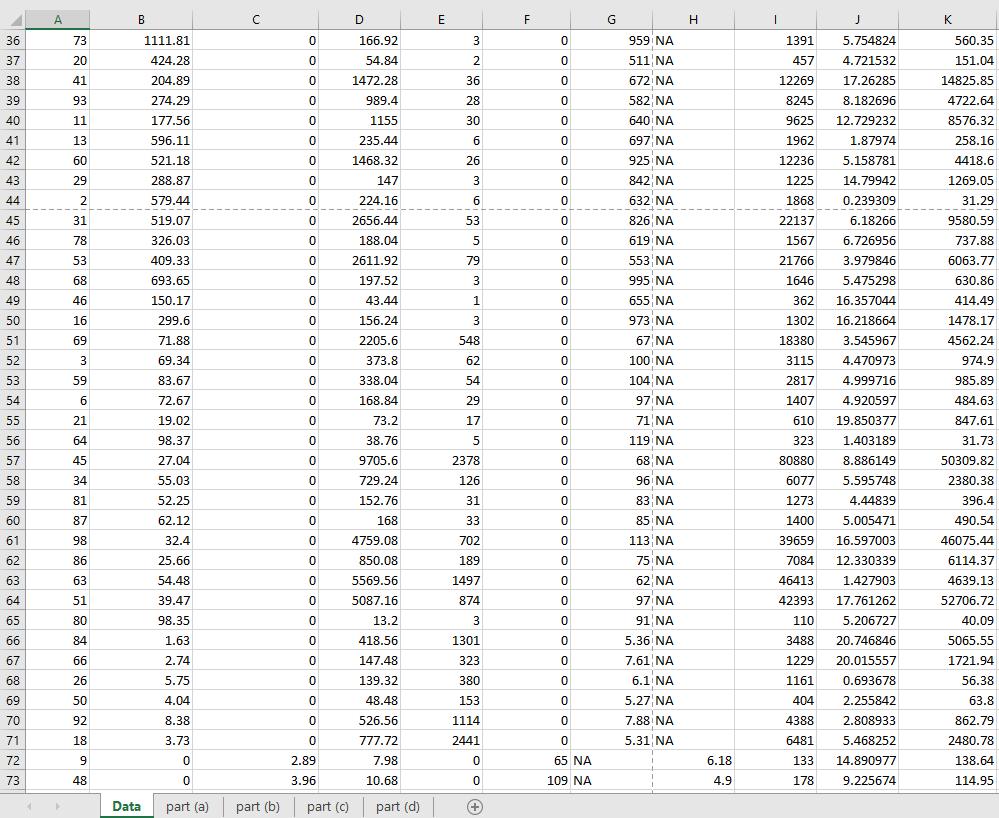
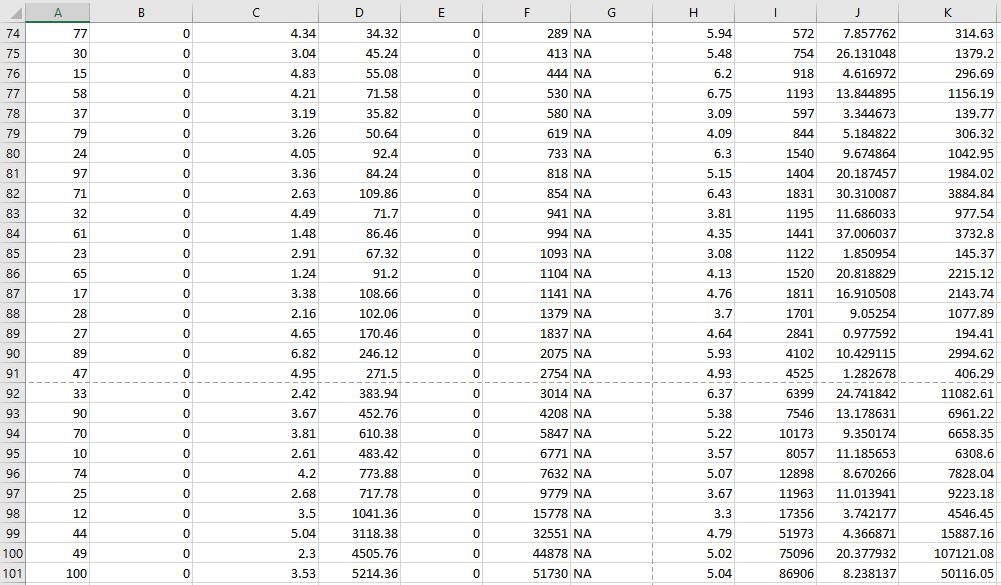
The included spreadsheet titled “Assignment2Data.xlsx” contains data on the costs for a sample of small agri-businesses in Kansas. Use it to answer the following questions. The table shows each farm’s crop output, crop price, cost of supplies, and cost of labor. For a livestock farm (ranch) it shows the livestock sold, the price per head, cost of maintaining each animal, and labor cost. It also shows the size (measured in acres) of the firm’s land holding, the price of land (per acre) in the local area. Multiplying these gives the value of the land. In this class we have not learned the mathematical tools necessary to use this land value for what we need in this assignment. Therefore, I have calculated the “annuitized value of that land”. This is how much the land is worth on an annual basis and this is what you should use to answer the questions in this problem.


a. From the data in the spreadsheet, calculate the explicit cost of production for each farm. What is the minimum, the 10th percentile, the median, the 90th percentile, and the maximum of explicit cost? Show your work in the spreadsheet in the tab labeled “part (a)” and summarize your answer in your answer document. Be sure to label your answers in the spreadsheet.
b. From the data in the spreadsheet, calculate the implicit (opportunity) cost of production per dollar of revenue for each farm. What are the quartiles of implicit cost? Show your work in the spreadsheet in the tab labeled “part (b)” and summarize your answer in your answer document. Be sure to label your answers in the spreadsheet.
c. From the data in the spreadsheet, calculate the accounting profit for each farm. What are the quintiles of accounting profit? Show your work in the spreadsheet in the tab labeled “part (c)” and summarize your answer in your answer document. Be sure to label your answers in the spreadsheet.
d. From the data in the spreadsheet, calculate the economic profit for each farm. Produce a histogram of the economic profit. Show your work and your graph in the spreadsheet in the tab labeled “part (d)”. Be sure to label your answers in the spreadsheet.
e. Are there any farms that should shut down and sell their land? How many? A farm that is just barely on the cusp of shutting down is what percentile of profit?
Feed (per animal per lyear) Supplies (per Cost of Livestock Crop Annuitized Land price value of land (annual) bushel produced Labor sold Production Livestock Crop price 716 NA 1 Firm ID per year) (annually) (annually) (bu annually) price Acres per acre 2 96 372.23 205.2 1710 6.352731 760.42 3 57 1055.75 170.16 997 NA 1418 5.015677 497.86 4 54 128.31 102.6 518 NA 855 10.608187 634.9 5 38 394.05 149.28 3 820 NA 1244 18.296109 1593.23 6 19 375.2 2712.6 58 780 NA 22605 9.140271 14463.11 7 62 609.02 1878.48 32 969 NA 15654 9.20658 10088.39 8 328.31 256.08 4 992 NA 2134 7.814499 1167.33 72 801.83 215.04 711 NA 1792 6.915977 867.54 770 NA 804 NA 10 55 655.15 3704.04 80 30867 2.742335 5925.34 11 52 483.01 3166.56 65 26388 11.989788 22147.06 12 99 715.86 76.92 2 693 NA 641 1.770608 79.45 13 88 363.98 153.36 5 551 NA 1278 11.301408 1011.02 611 NA 645 NA 14 42 683.59 920.88 25 7674 3.533534 1898.14 15 82 275.58 220.32 6 1836 16.009858 2057.59 16 40 600.53 211.44 998 NA 1762 7.449563 918.83 17 67 748.51 67.92 651 NA 566 9.467261 375.09 18 364.34 4625.64 82 938 NA 38547 22.018249 59411.62 19 39 166.04 902.28 24 640 NA 7519 10.12395 5328.54 20 36 531.04 205.32 620 NA 1711 1.457621 174.58 21 35 672.97 11986.08 258 774 NA 99884 1.157156 8090.69 22 43 299.61 4662.12 88 876 NA 38851 8.914322 24243.12 23 95 371.23 179.28 4 881 NA 1494 18.222691 1905.73 24 22 284.37 125.76 746 NA 1048 8.702271 638.4 25 4 670.77 1197.96 25 789 NA 9983 2.942435 2056.2 26 14 586.14 1251 31 674 NA 10425 0.810625 591.55 589 NA 546 NA 27 76 293.5 982.32 27 8186 17.553303 10058.39 28 56 272.31 233.64 7 1947 17.394664 2370.72 29 8 372.85 221.52 6 564 NA 1846 6.463397 835.2 30 83 485.01 737.04 18 673 NA 6142 6.300348 2708.77 31 91 226.3 558.84 17 544 NA 4657 20.194761 6583.29 32 85 493.09 843.96 19 731 NA 7033 9.643346 4747.52 33 94 338.4 1431.48 36 654 NA 11929 15.475537 12922.54 34 75 788.91 105.24 2. 702 NA 877 5.173238 317.58 35 1. 500.41 206.88 4 885 NA 1724 9.119936 1100.59 Data part (a) part (b) part (c) part (d) +
Step by Step Solution
3.45 Rating (152 Votes )
There are 3 Steps involved in it
Step: 1
From the data in the spreadsheet calculate the economic profit for each farmFeed per Supplies per animal per bushel produced 1 Firm ID Lyear per year 2 96 37223 3 57 105575 4 54 12831 39405 5 6 38 19 ...
Get Instant Access to Expert-Tailored Solutions
See step-by-step solutions with expert insights and AI powered tools for academic success
Step: 2

Step: 3

Ace Your Homework with AI
Get the answers you need in no time with our AI-driven, step-by-step assistance
Get Started


