
From your personal experience, give examples of three goods that (for you) have the following income elasticity of demand:
+4, + 2.5,-1
Explain what these coefficients mean.
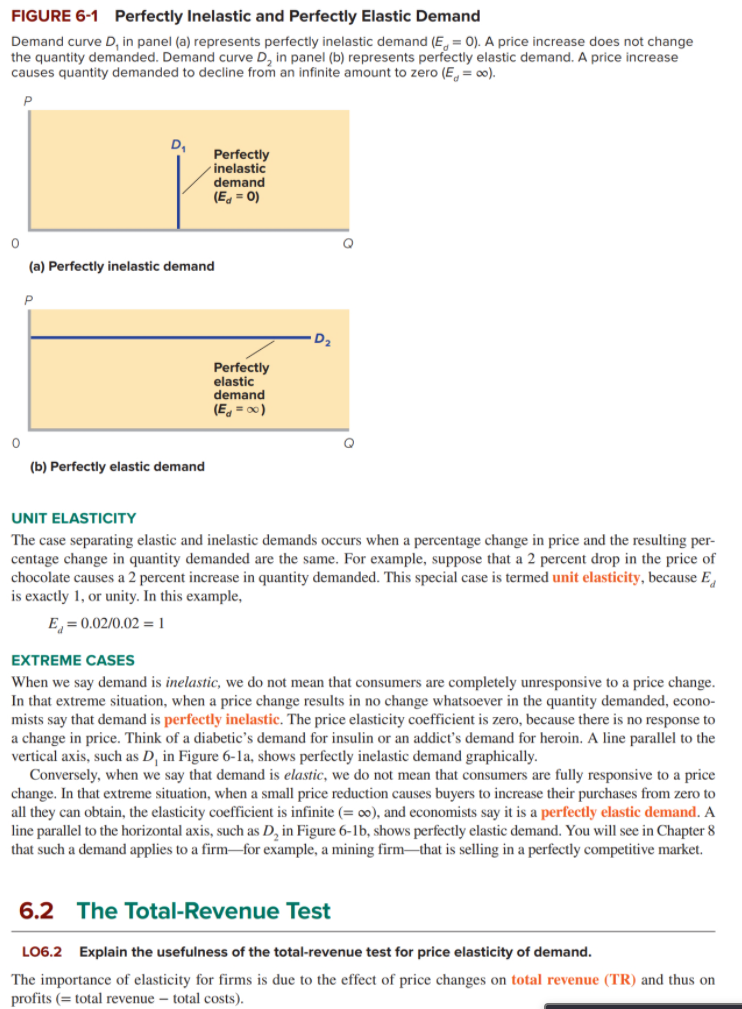
6.1 Price Elasticity of Demand LO6.1 Discuss price elasticity of demand and how it is calculated. The law of demand tells us that, other things equal, consumers will buy more of a product when its price declines and less when its price increases. But how much more or less will they buy? The amount varies from product to product and over different price ranges for the same product. It also may vary over time. And such variations mat- ter. For example, a firm contemplating a price hike will want to know how consumers will respond. If they remain highly loyal and continue to buy, the firm's revenue will rise. But if consumers defect en masse to other sellers or other products, the firm's revenue will tumble. The responsiveness (or sensitivity) of consumers to a price change is measured by a product's price elasticity of demand. For some products-for example, restaurant meals-consumers are highly responsive to price changes. Modest price changes cause very large changes in the quantity purchased. Economists say that the demand for such products is relatively elastic or simply elastic. For other products-for example, toothpaste-consumers are less responsive to price changes. Substantial price changes cause only small changes in the amount purchased. The demand for such products is relatively inelastic or simply inelastic. The Price Elasticity Coefficient and Formula We measure the degree to which demand is elastic or inelastic with the coefficient E defined as Ed = P percentage change in quantity demanded of product X percentage change in price of product X MATH 6.1 Elasticity Let's look at a specific example from Table 6-1, rows 1 to 3, to see how the price elasticity of demand is calculated (don't worry about columns 4 and 5 for now; they will be discussed later). This table shows the number of movie tickets demanded (in thousands) per week at each specified price. Let's calculate E, for, say, the $5 to $4 price range. But before we do so, let's look at how we calculate a percentage. CALCULATING A PERCENTAGE CHANGE To calculate the percentage change in quantity demanded between two points, we divide the change in quantity demanded (AQ,) by the original quantity demanded (Q ) that we are considering. (Note that the Greek letter delta [A] signifies "change in.") % AQ. = change in quantity demanded of product X original quantity of product X x 100%TABLE 6-1 Price Elasticity of Demand for Movie Tickets as Measured by the Elasticity Coefficient and the Total-Revenue Test Total quantity (2) (3) (4) (5) demanded per week Price Elasticity Total revenue Total-revenue (thousands) per ticket coefficient, E (1) x (2) test $8 5.00 $ 8,000 AWN Elastic 7 2.60 14,000 Elastic 6 1.57 18,000 5 Elastic 20,000 A 1.00 Unit elastic 0.64 20,000 18,000 Inclastic 0.38 14,000 Inelastic 0.20 8,000 Inelastic For example, if the quantity demanded increases from 4 to 5 units, the percentage change in quantity demanded is calculated as follows: % AQ = AQd x 100% = 25% To calculate the percentage change in price between two points, we divide the change in price (AP) by the original price (Po): % AP = - change in price of product X original price of product X X 100% For example, if the price dropped from $5 to $4, the percentage change in price is calculated as follows: %% AP = - AP Po X 100% = 20% USING AVERAGES Unfortunately, an annoying problem arises in computing the price elasticity coefficient. A price change, say from $4 to $5, is a 25 percent (= $1/$4) increase; the quantity change from 5 to 4 units is a 20 percent (= 1/5) decrease in quantity, resulting in a price elasticity of 0.8 (= 20/25). But an opposite price change, from $5 to $4, is a 20 per- cent (=$1/$5) decrease; the quantity change from 4 to 5 units is a 25 percent increase, resulting in a price elasticity of 1.25 (= 25/20). Which percentage change in price should we use in the denominator to compute the price elastic- ity coefficient? And when quantity changes, for example, from 10 to 20, it is a 100 percent (=10/10) increase. But when quantity falls from 20 to 10 along the identical demand curve, it is a 50 percent (10/20) decrease. Should we use 100 percent or 50 percent in the numerator of the elasticity formula? Elasticity should be the same whether price rises or falls! The simplest solution to the problem is to use the midpoint formula for calculating elasticity. This formula simply averages the two prices and the two quantities as the reference points for computing the percentages. That is, Ed = change in quantity change in price sum of quantities/2 * sum of prices/2In symbols, the formula becomes AP Ed = (20 + (1)/2 (Po + P1)/2 WORKED PROBLEM 6.1 Elasticity of Demand For the same $5 to $4 price range, the price reference is $4.50 (= ($5 + $4)/2), and for the same 10 to 20 quan- tity range, the quantity reference is 15 units (= (10 + 20)/2). The percentage change in price is now $1/$4.50, or about 22 percent, and the percentage change in quantity is 10/15, or also about 67 percent. So E is about 3. This solution eliminates the "up versus down" problem. All the price elasticity coefficients that follow are calculated using this midpoint formula. USING PERCENTAGES Why use percentages rather than absolute amounts in measuring consumer responsiveness? There are two reasons. First, if we use absolute changes, the choice of units will arbitrarily affect our impression of buyer respons siveness. To illustrate, if the price of a bag of popcorn at the local hockey game is reduced from $3 to $2, and consumers increase their purchases from 60 to 100 bags, it appears that consumers are quite sensitive to price changes and, therefore, that demand is elastic. After all, a price change of 1 unit has caused a change of 40 units in the amount demanded. But by changing the monetary unit from dollars to pennies (why not?), we find that a price change of 100 units (pennies) causes a quantity change of 40 units. This result may falsely lead us to believe that demand is inelastic. We avoid this problem by using percentage changes. This particular price decline is the same whether we measure in dollars or pennies. Second, by using percentages, we can correctly compare consumer responsiveness to changes in the prices of different products. It makes little sense to compare the effects on quantity demanded of a $1 increase in the price of a $10,000 used car with a $1 increase in the price of a $1 soft drink. Here the price of the used car increased by 0.01 percent, while the price of the soft drink increased by 100 percent. We can more sensibly compare the con- sumer responsiveness to price increases by using some common percentage increase in price for both. ELIMINATING THE MINUS SIGN We know from the downsloping demand curve shown in Chapter 3 that price and quantity demanded are inversely related. Thus, the price elasticity coefficient of demand E, will always be a negative number. Economists usually ignore the minus sign and simply present the absolute value of the elasticity coefficient to avoid an ambiguity that might otherwise arise. It can be confusing to say that an E. of -4 is greater than an E. of -2. This possible confu- sion is avoided when we say that an E, of 4 reveals greater elasticity than an E, of 2. Incidentally, the ambiguity does not arise with supply because price and quantity supplied are positively related. All elasticity of supply coef- ficients, therefore, are positive numbers. Interpretation of Ed We interpret the coefficient of price elasticity of demand (E ) as follows. ELASTIC DEMAND Demand is elastic (elastic demand exists) if a specific percentage change in price results in a larger percentage change in quantity demanded. In such cases, E, will be greater than 1. For example, suppose that a 2 percent decline in the price of cut flowers results in a 4 percent increase in quantity demanded. Then demand for cut flowers is elastic and E = 0.04/0.02 = 2 INELASTIC DEMAND If a specific percentage change in price produces a smaller percentage change in quantity demanded, demand is inelastic (inelastic demand exists). In such cases, E, will be less than 1. For example, suppose that a 2 percent decline in the price of coffee leads to only a 1 percent increase in quantity demanded. Then demand is inelastic and E = 0.01/0.02 = 01 = 0.5FIGURE 6-1 Perfectly Inelastic and Perfectly Elastic Demand Demand curve D, in panel (a) represents perfectly inelastic demand (E. = 0). A price increase does not change the quantity demanded. Demand curve D, in panel (b) represents perfectly elastic demand. A price increase causes quantity demanded to decline from an infinite amount to zero (E. = co). D Perfectly inelastic demand (Ed = 0) O (a) Perfectly inelastic demand D2 Perfectly elastic demand (Eg = 00) 0 (b) Perfectly elastic demand UNIT ELASTICITY The case separating elastic and inelastic demands occurs when a percentage change in price and the resulting per- centage change in quantity demanded are the same. For example, suppose that a 2 percent drop in the price of chocolate causes a 2 percent increase in quantity demanded. This special case is termed unit elasticity, because E is exactly 1, or unity. In this example, E = 0.02/0.02 = 1 EXTREME CASES When we say demand is inelastic, we do not mean that consumers are completely unresponsive to a price change. In that extreme situation, when a price change results in no change whatsoever in the quantity demanded, econo- mists say that demand is perfectly inelastic. The price elasticity coefficient is zero, because there is no response to a change in price. Think of a diabetic's demand for insulin or an addict's demand for heroin. A line parallel to the vertical axis, such as D, in Figure 6-la, shows perfectly inelastic demand graphically. Conversely, when we say that demand is elastic, we do not mean that consumers are fully responsive to a price change. In that extreme situation, when a small price reduction causes buyers to increase their purchases from zero to all they can obtain, the elasticity coefficient is infinite (= co), and economists say it is a perfectly elastic demand. A line parallel to the horizontal axis, such as D, in Figure 6-1b, shows perfectly elastic demand. You will see in Chapter 8 that such a demand applies to a firm-for example, a mining firm-that is selling in a perfectly competitive market. 6.2 The Total-Revenue Test LO6.2 Explain the usefulness of the total-revenue test for price elasticity of demand. The importance of elasticity for firms is due to the effect of price changes on total revenue (TR) and thus on profits (= total revenue - total costs).FIGURE 6-2 The Total-Revenue Test for Price Elasticity (a) Price declines from $2 to $1, and total revenue increases from $20 to $40. So demand is elastic. The gain in revenue (green area) exceeds the loss of revenue (blue area). (b) Price declines from $4 to $1, and total revenue falls from $40 to $20. So demand is inelastic. The gain in revenue (green area) is less than the loss of revenue (blue area). (c) Price declines from $3 to $1, and total revenue does not change. Demand is unit elastic. The gain in revenue (green area) equals the loss of revenue (blue area). $4 $3 3 $3 Loss 2 Loss Loss D DA - D3 Gain Gain Gain 0 10 20 30 40 O 10 20 0 10 20 30 (a) Elastic (b) Inelastic (c) Unit elastic Total revenue (TR) is the total amount the seller receives from the sale of a product (or service) in a particular time period; it is calculated by multiplying the product price (P) by the quantity demanded and sold (Q). In equa- tion form, TR = P x Q MATH 6.2 The Total-Revenue Test Graphically, total revenue is represented by the P X Q rectangle lying below a point on a demand curve. At point a in Figure 6-2a, for example, price is $2 and quantity demanded is 10 units. So total revenue is $20 (= $2 x 10), shown by the rectangle composed of the blue and purple areas under the demand curve. We know from basic geom- etry that the area of a rectangle is found by multiplying one side by the other. Here, one side is price ($2) and the other is quantity demanded (10 units). Total revenue and the price elasticity of demand are related. In fact, the easiest way to determine whether demand is elastic or inelastic is to employ the total-revenue test. Note what happens to total revenue when price changes. If total revenue changes in the opposite direction from price, demand is elastic. If total revenue changes in the same direction as price, demand is inelastic. If total revenue does not change when price changes, demand is unit elastic. Elastic Demand If demand is elastic, a decrease in price will increase total revenue. Even though a lesser price is received per unit, enough additional units are sold to more than make up for the lower price. For example, look at demand curve D, in Figure 6-2a. We have already established that at point a, total revenue is $20 (= $2 x 10), shown as the purple plus blue areas. If the price declines from $2 to $1 (point b), the quantity demanded becomes 40 units and total revenue is $40 (= $1 x 40). As a result of the price decline, total revenue has increased from $20 to $40. Total revenue has increased in this case because the $1 decline in price applies to 10 units, with a consequent revenueTABLE 6-3 Selected Price Elasticities of Demand Coefficient of price Coefficient of price Product or service elasticity of demand, E Product or service elasticity of demand, E Newspapers 0.10 Household appliances 0.63 Electricity (household) 0.13 Movies 0.87 Bread 0.15 Beer 0.90 Major League Baseball tickets 0.23 Shoes 0.91 Telephone service 0.26 Motor vehicles 1.14 Sugar 0.30 Beef 1.27 Eggs 0.32 China, glassware, tableware 1.54 Legal services 0.37 Residential land 1.60 Automobile repair 0.40 Restaurant meals 2.27 Clothing 0.49 Lamb and mutton 2.65 Gasoline 0.60 Fresh peas 2.83 Milk 0.63 Source: Compiled from numerous studies and sources reporting price elasticity of demand. Another consideration is product durability. Studies show that short-run demand for gasoline is more inelastic (E = 0.2) than long-run demand (E. = 0.7). In the short run, people are stuck with their present cars and trucks, but with rising gasoline prices they will eventually replace them with smaller, more fuel-efficient vehicles, or switch to mass transit where it is available. Table 6-3 shows estimated price-elasticity coefficients for a number of products. Each reflects some combina- tion of the elasticity determinants just discussed. Applications of Price Elasticity of Demand The concept of price elasticity of demand has great practical significance, as the following examples suggest. LARGE CROP YIELDS The demand for most farm products is highly inelastic; E, is perhaps 0.20 or 0.25. As a result, increases in the sup- ply of farm products arising from a good growing season or from increased productivity tend to depress both the prices of farm products and the total revenues (incomes) of farmers. For farmers as a group, the inelastic demand for their product means that a large crop may be undesirable. For policymakers it means that achieving the goal of higher total farm income requires that farm output be restricted. SALES TAXES Both federal and provincial governments pay attention to elasticity of demand when selecting goods and services on which to levy sales taxes. If a $1 tax is levied on a product and 10,000 units are sold, tax revenue will be $10,000 (= $1 x 10,000 units sold). If the government raises the tax to $1.50 but the higher price reduces sales to 5000 because of elastic demand, tax revenue will decline to $7500 (= $1.50 x 5000 units sold). Because a higher tax on a product with elastic demand will bring in less tax revenue, legislatures seek out products that have inelastic demand-such as liquor, gasoline, and cigarettes-when levying sales tax. DECRIMINALIZETION OF ILLEGAL DRUGS In recent years proposals to legalize drugs have been widely debated. Proponents contend that drugs should be treated like alcohol: made legal for adults and regulated for purity and potency. Effort We've updated our read aloud feature