fs=8000,data=82543*1,please anwer all these problem in mathlab by using matlabbackground,The final phote for problem (e)
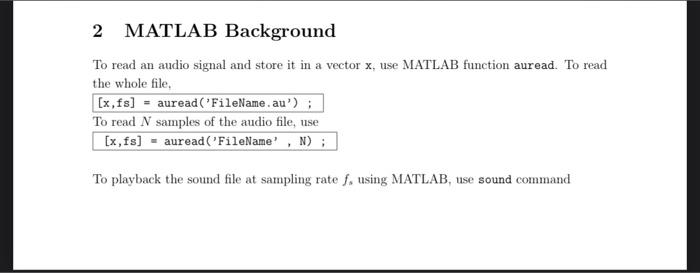
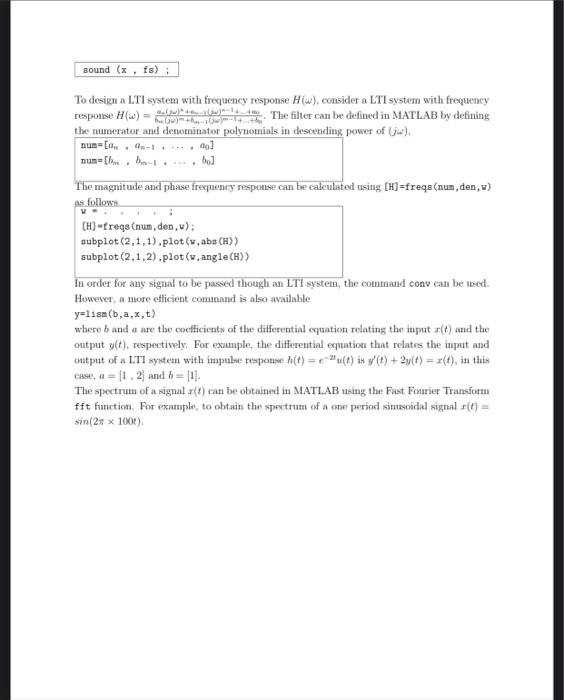
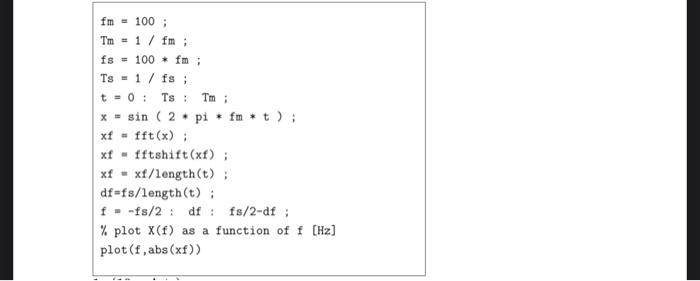
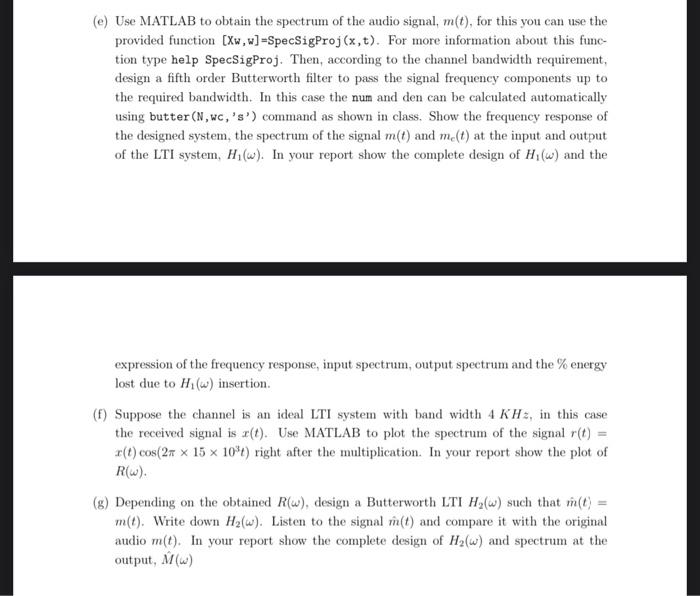
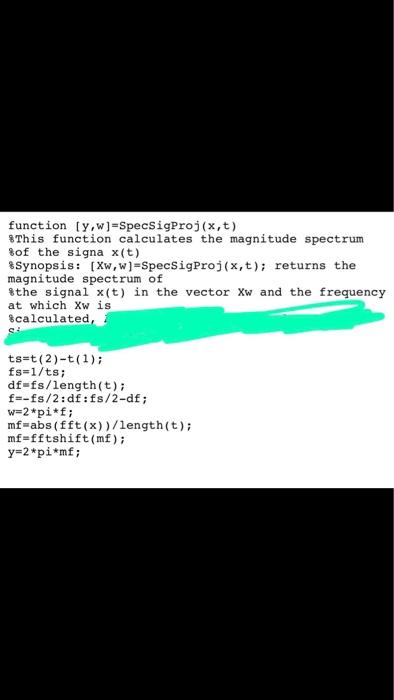
MATLAB Background To read an audio signal and store it in a vector x, use MATLAB function auread. To read the whole file, [x, fs] - auread('FileName.au'); To read N samples of the audio file, use [x,fs] - auread('FileName', N) ; To playback the sound file at sampling rate f. using MATLAB, use sound command sound (x, fs) To design a LTI system with frequency response Hw), consider a LTI system with frequency response ) The filter can be defined in MATLAB by defining the numerator and denominator polynomials in descending power of Gw). nunca, 0, 0] The magnitude and phase frequency response can be calculated using (H)=freqs (num, den,w) as follows CH)-freqs (num, den,w): subplot(2,1,1).plot(w, aba (H) subplot(2,1,2).plot(w,angle(H)) In order for any signal to be passed though an LTI system, the command conv can be lised. However, a more efficient command is also available y=lism (b,a,x,t) where b and a are the coefficients of the differential equation relating the input (t) and the output y(t), respectively. For example, the differential equation that relates the input and output of a LTI system with impulse response (t) = -(t) is (t) + 2y(t) = *(t), in this case, a = 11.2) and b = 111. The spectrum of a signal r(t) can be obtained in MATLAB using the Fast Fourier Transform fft function. For example, to obtain the spectrum of a one period simsical signal r(t) = sin(21 x 100). fm - 100; Tm - 1 / fm ; fs = 100.fm Ts - 1/fs ; t = 0: Ts: Tm; x = sin ( 2. pi . fm t); xf = fft(x); xf - fftshift(xf); xf = xf/length(t): df=fs/length(t); f. -fs/2: df: fs/2-df; % plot X(f) as a function of f [Hz] plot(f,abs(x)) (e) Use MATLAB to obtain the spectrum of the audio signal, m(t), for this you can use the provided function [Xw.w]=SpecSigProj(x,t). For more information about this func- tion type help SpecSigProj. Then, according to the channel bandwidth requirement, design a fifth order Butterworth filter to pass the signal frequency components up to the required bandwidth. In this case the num and den can be calculated automatically using butter (N,wc,'S') command as shown in class. Show the frequency response of the designed system, the spectrum of the signal m(t) and melt) at the input and output of the LTI system, H.(w). In your report show the complete design of H. (w) and the expression of the frequency response, input spectrum, output spectrum and the % energy lost due to H1 (w) insertion. (f) Suppose the channel is an ideal LTI system with band width 4 KHz, in this case the received signal is r(t). Use MATLAB to plot the spectrum of the signal r(t) = r(t) cos(2 x 15 x 10%t) right after the multiplication. In your report show the plot of Rw). (g) Depending on the obtained Rw), design a Butterworth LTI H.(w) such that m(t) = m(t). Write down Hz(w). Listen to the signal m(t) and compare it with the original audio m(t). In your report show the complete design of Hz(w) and spectrum at the output, MW) function ty,w]-Specs igProj(x,t) *This function calculates the magnitude spectrum of the signa x(t) Synopsis: [Xw, w]=SpecSigProj(x,t); returns the magnitude spectrum of 8the signal x(t) in the vector Xw and the frequency at which Xw is $calculated, S ts=t(2) -t(1); fs=1/ts; df-fs/length(t); fr-fs/2:df:f/2-df; w=2*pi*f; mf=abs(fft(x))/length(t); mf=fftshift(m); y=2*pi*mf; MATLAB Background To read an audio signal and store it in a vector x, use MATLAB function auread. To read the whole file, [x, fs] - auread('FileName.au'); To read N samples of the audio file, use [x,fs] - auread('FileName', N) ; To playback the sound file at sampling rate f. using MATLAB, use sound command sound (x, fs) To design a LTI system with frequency response Hw), consider a LTI system with frequency response ) The filter can be defined in MATLAB by defining the numerator and denominator polynomials in descending power of Gw). nunca, 0, 0] The magnitude and phase frequency response can be calculated using (H)=freqs (num, den,w) as follows CH)-freqs (num, den,w): subplot(2,1,1).plot(w, aba (H) subplot(2,1,2).plot(w,angle(H)) In order for any signal to be passed though an LTI system, the command conv can be lised. However, a more efficient command is also available y=lism (b,a,x,t) where b and a are the coefficients of the differential equation relating the input (t) and the output y(t), respectively. For example, the differential equation that relates the input and output of a LTI system with impulse response (t) = -(t) is (t) + 2y(t) = *(t), in this case, a = 11.2) and b = 111. The spectrum of a signal r(t) can be obtained in MATLAB using the Fast Fourier Transform fft function. For example, to obtain the spectrum of a one period simsical signal r(t) = sin(21 x 100). fm - 100; Tm - 1 / fm ; fs = 100.fm Ts - 1/fs ; t = 0: Ts: Tm; x = sin ( 2. pi . fm t); xf = fft(x); xf - fftshift(xf); xf = xf/length(t): df=fs/length(t); f. -fs/2: df: fs/2-df; % plot X(f) as a function of f [Hz] plot(f,abs(x)) (e) Use MATLAB to obtain the spectrum of the audio signal, m(t), for this you can use the provided function [Xw.w]=SpecSigProj(x,t). For more information about this func- tion type help SpecSigProj. Then, according to the channel bandwidth requirement, design a fifth order Butterworth filter to pass the signal frequency components up to the required bandwidth. In this case the num and den can be calculated automatically using butter (N,wc,'S') command as shown in class. Show the frequency response of the designed system, the spectrum of the signal m(t) and melt) at the input and output of the LTI system, H.(w). In your report show the complete design of H. (w) and the expression of the frequency response, input spectrum, output spectrum and the % energy lost due to H1 (w) insertion. (f) Suppose the channel is an ideal LTI system with band width 4 KHz, in this case the received signal is r(t). Use MATLAB to plot the spectrum of the signal r(t) = r(t) cos(2 x 15 x 10%t) right after the multiplication. In your report show the plot of Rw). (g) Depending on the obtained Rw), design a Butterworth LTI H.(w) such that m(t) = m(t). Write down Hz(w). Listen to the signal m(t) and compare it with the original audio m(t). In your report show the complete design of Hz(w) and spectrum at the output, MW) function ty,w]-Specs igProj(x,t) *This function calculates the magnitude spectrum of the signa x(t) Synopsis: [Xw, w]=SpecSigProj(x,t); returns the magnitude spectrum of 8the signal x(t) in the vector Xw and the frequency at which Xw is $calculated, S ts=t(2) -t(1); fs=1/ts; df-fs/length(t); fr-fs/2:df:f/2-df; w=2*pi*f; mf=abs(fft(x))/length(t); mf=fftshift(m); y=2*pi*mf