

Answered step by step
Verified Expert Solution
Question
1 Approved Answer
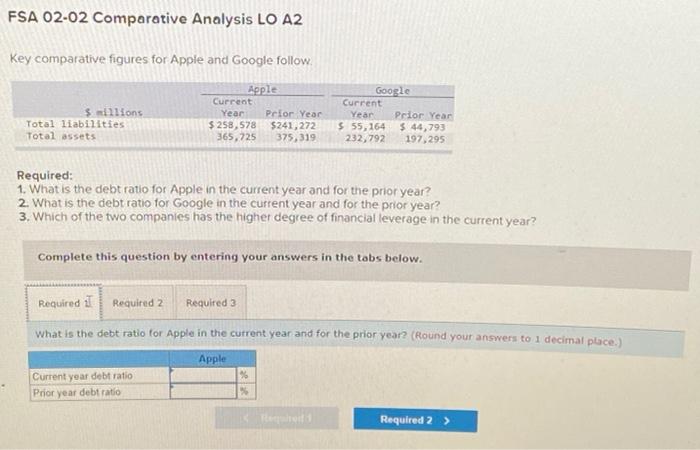
FSA 02-02 Comparative Analysis LO A2 Key comparative figures for Apple and Google follow. millions Total liabilities Total assets Apple Current Year Prior Year $
Step by Step Solution
There are 3 Steps involved in it
Step: 1

Get Instant Access to Expert-Tailored Solutions
See step-by-step solutions with expert insights and AI powered tools for academic success
Step: 2

Step: 3
Ace Your Homework with AI
Get the answers you need in no time with our AI-driven, step-by-step assistance
Get Started
Studies Of Company Records (RLE Accounting)1830-1974
Authors: J. R. Edwards
1st Edition
1138983306, 9781138983304