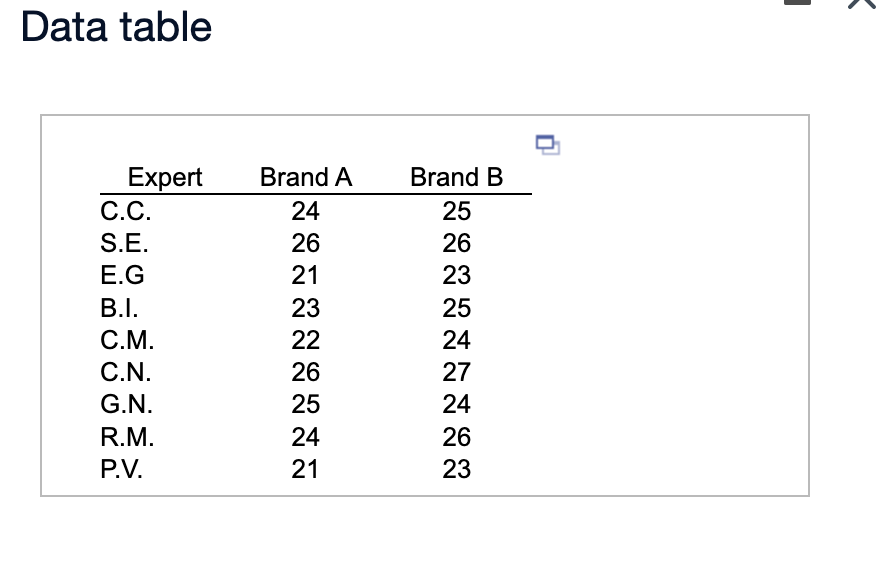
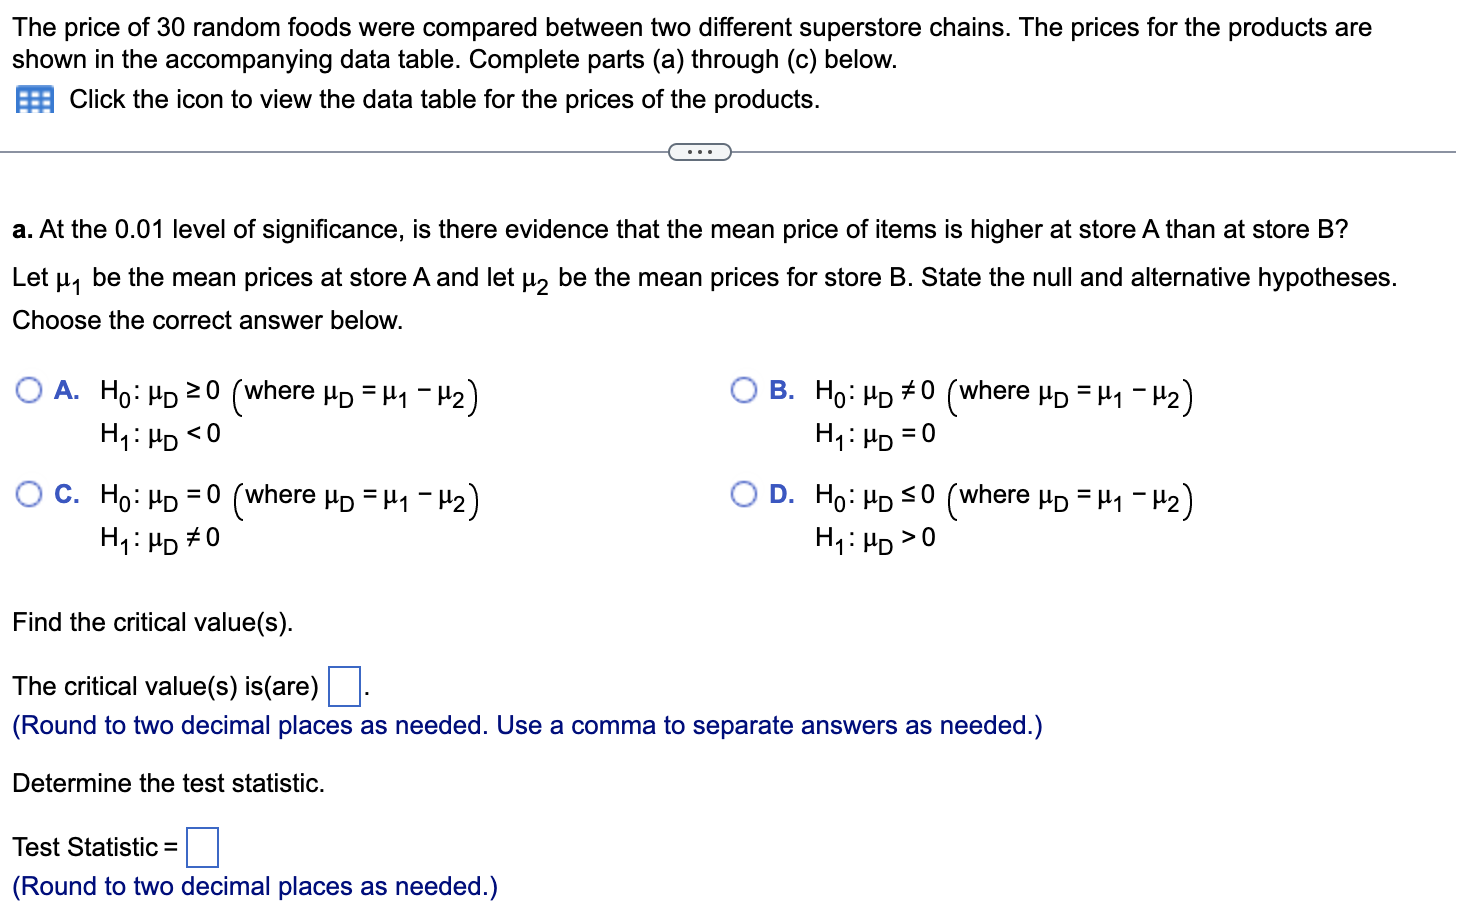
fThe price of 30 random foods were compared between two different superstore chains. The prices for the products are shown in the accompanying data table.
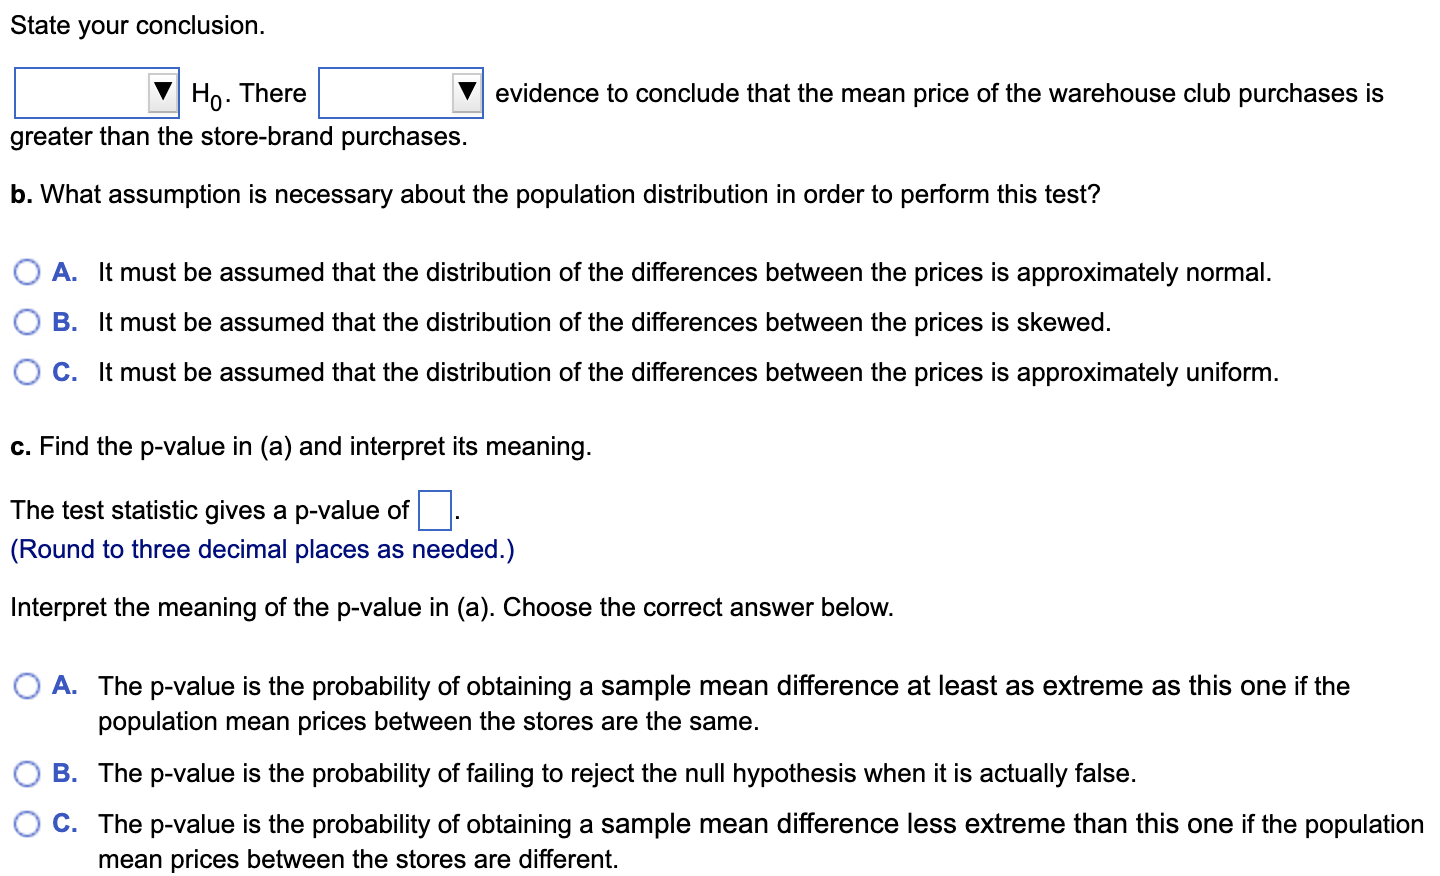
\fThe price of 30 random foods were compared between two different superstore chains. The prices for the products are shown in the accompanying data table. Complete parts (a) through (c) below. Click the icon to View the data table for the prices of the products. c:> a. At the 0.01 level of signicance, is there evidence that the mean price of items is higher at store A than at store B? Let p1 be the mean prices at store Aand let p2 be the mean prices for store B. State the null and alternative hypotheses. Choose the correct answer below. 0 A. HO: pDZO (where 110 =p1-p2) O B. HO: \"D #0 (where M) =p1-p2) H1zpD0 Find the critical value(s)_ The critical value(s) is(are) D. (Round to two decimal places as needed. Use a comma to separate answers as needed.) Determine the test statistic. Test Statistic = D (Round to two decimal places as needed.) State your conclusion. l:| H0. There |:| evidence to conclude that the mean price of the warehouse club purchases is greater than the store-brand purchases. b. What assumption is necessary about the population distribution in order to perform this test? 0 A. It must be assumed that the distribution of the differences between the prices is approximately normal. 0 B. It must be assumed that the distribution of the differences between the prices is skewed. O c. It must be assumed that the distribution of the differences between the prices is approximately uniform. c. Find the p-value in (a) and interpret its meaning. The test statistic gives a p-value of D. (Round to three decimal places as needed.) Interpret the meaning of the p-value in (a). Choose the correct answer below. 0 A. The p-value is the probability of obtaining a sample mean difference at least as extreme as this one if the population mean prices between the stores are the same. 0 B. The p-value is the probability of failing to reject the null hypothesis when it is actually false. 0 c. The p-value is the probability of obtaining a sample mean difference less extreme than this one if the population mean prices between the stores are different. \f25 1.03 1.19 26 0.87 0.98 27 3.99 4.17 28 2.95 2.54 29 3.65 1.79 30 1.27 0.92Increased blood vessel formulation is a predictive factor in survival for a certain disease. One treatment is stem cell transplantation with the patient's own stem cells. The accompanying data table represents the microvessel density for patients who had a complete response to the stem cell transplant. The measurements were taken immediately prior to the stem cell transplant and at the time the complete response was determined. Complete parts (a) through (d). Click the icon to view the data table. E) a. At the 0.10 level of signicance, is there evidence that the mean microvessel density is higher before the stem cell transplant than after the stem cell transplant? Let p1 be the mean density before the transplant and let p2 be the mean density after the transplant. State the null and alternative hypotheses. Choose the correct answer below. 0 A. H0: FD 50 (where pD =p1/p2) O B. H0415, =0 (where "D =p1-u2) H1:pD>0 H1:p.D>0 O C. H041D #0 (where "D =p1/u2) O D. Ho: uD 50 (where pD =p1-p2) H1Z|.lD=0 H1zpD>0 O E. H0: pD =0 (where pD =|.l.1|.12) O F. HO: pD 20 (where 140 =p1-p2) The test statistic = D. (Round to two decimal places as needed.) The p-value is D. (Round to three decimal places as needed.) Since the p-value is |:l the value of or, |:I There is |:l evidence to conclude that the mean microvessel density is higher before the stem cell transplant than after the stem cell transplant. b. Interpret the meaning of the p-value in (a). Choose the correct answer below. 0 A. The p-value is the probability of not rejecting the null hypothesis when it is false. 0 B. The p-value is the probability of obtaining a sample mean difference of 82.57 or more if the population mean densities both before and after the transplant are the same. 0 C. The p-value is the probability of obtaining a sample mean difference of 82.57 or more if the population mean densities both before and after the transplant are different. cl. What assumption is necessary about the population distribution in order to perform the test in (a)? O A. It must be assumed that the distribution of the differences between the measurements is approximately normal. 0 B. It must be assumed that the distribution of the differences between the measurements is approximately uniform. O C. It must be assumed that the distribution of the differences between the measurements is skewed. Data table Patient Before After 183 345 191 110 204 243 YOUDON- 374 227 412 282 422 158 446 289To assess the effectiveness of a cola video ad for cola B, a random sample of 35 individuals from a target audience was selected to participate in a copy test. Participants viewed two ads, one of which was the ad being tested (cola B). Participants then answered a series of questions about how much they liked the ads. An adindex measure was created and shown in the accompanying table; the higher the adindex value, the more likeable the ad. State your ndings and conclusions. Assume a = 0.05. a Click the icon to view the data table of the adindex ratings. E) Compute the descriptive statistics. Find the mean of the adindex ratings for cola A. D (Round to two decimal places as needed.) Find the mean of the adindex ratings for cola B. Mean after workshops = D (Round to two decimal places as needed.) Find the mean of the difference of the adindex ratings for cola A and cola B. (Assume the difference to be the cola A data value minus the cola B data value) Mean of the difference = D (Round to two decimal places as needed.) Perform a paired t test. Let u, be the population mean adindex rating for cola A and let H2 be the population mean adindex rating for cola B. What are the null and alternative hypotheses? O A. Ho: HD $ 0 (where HD = M1 - M2) O B. Ho: HD =0 (where MD = M1 - H2) H1 : HD = 0 H1: HD # 0 O C. Ho: HD 20 (where HD = M1 - H2) O D. Ho: HD SO (where HD = M1 - H2) Hy : HD 0 Determine the test statistic. Test Statistic = (Round to two decimal places as needed.) Find the p-value for the test statistic. The p-value is (Round to three decimal places as needed.) State your conclusion. Ho. There sufficient evidence to conclude that the mean adindex ratings are higher for cola B than for cola A.Data table of the adindex ratings Cola A Cola B Cola A Cola B 77 81 76 94 69 67 84 64 78 79 60 67 68 82 72 66 80 76 87 65 66 89 73 91 77 76 73 76 80 63 65 90 86 89 81 83 76 94 66 89 61 82 70 71 67 91 88 91 60 83 85 80 74 63 77 89 86 73 79 77 88 84 75 73 71 64 73 73 79 74
Step by Step Solution
There are 3 Steps involved in it
Step: 1
Get Instant Access to Expert-Tailored Solutions
See step-by-step solutions with expert insights and AI powered tools for academic success
Step: 2
Step: 3
Ace Your Homework with AI
Get the answers you need in no time with our AI-driven, step-by-step assistance