Question
function Homework_3_3360_Spr_2021 clear all options=odeset('events',@StopSim); M=1000;K=2000;Vo=24;D=10;g=9.81; b=0.75*4*M*g/Vo [t,x]=ode45(@eqns,[0 3],[0 Vo],options); y=x(:,1);yd=x(:,2);ydd=-(b*yd+K*y)/M; plot(t,y/D,'r',t,yd/Vo,'k--',t,-ydd/g,'r.','linewidth',2) grid xlabel('time, s','fontsize',18) ylabel('normalized variables','fontsize',18) legend('normalized displacement, y/D','normalized velocity, y_d/V_o',... 'normalize deceleration, y_d_d/g','location','best')

function Homework_3_3360_Spr_2021
clear all
options=odeset('events',@StopSim);
M=1000;K=2000;Vo=24;D=10;g=9.81;
b=0.75*4*M*g/Vo
[t,x]=ode45(@eqns,[0 3],[0 Vo],options);
y=x(:,1);yd=x(:,2);ydd=-(b*yd+K*y)/M;
plot(t,y/D,'r',t,yd/Vo,'k--',t,-ydd/g,'r.','linewidth',2)
grid
xlabel('time, s','fontsize',18)
ylabel('normalized variables','fontsize',18)
legend('normalized displacement, y/D','normalized velocity, y_d/V_o',...
'normalize deceleration, y_d_d/g','location','best')
function dx=eqns(t,x)
Y=x(1);Yd=x(2);
dx=zeros(2,1);
dx(1)=Yd;
dx(2)=-(b*Yd+K*Y)/M;
end
function [Val,Ister,Dir]=StopSim(t,x)
Ister(1)=1;Val(1)=D-x(1);Dir(1)=-1;
Ister(2)=1;Val(2)=x(2);Dir(1)=-1;
end
end
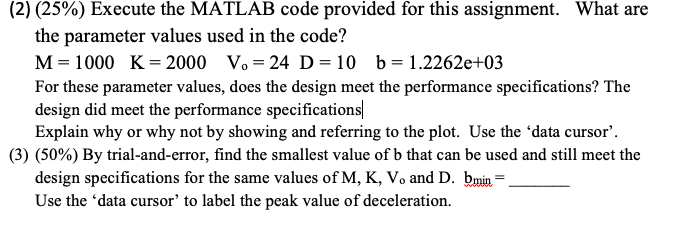
(2) (25%) Execute the MATLAB code provided for this assignment. What are the parameter values used in the code? M= 1000 K = 2000 V. = 24 D= 10 b= 1.2262e+03 For these parameter values, does the design meet the performance specifications? The design did meet the performance specifications Explain why or why not by showing and referring to the plot. Use the 'data cursor'. (3) (50%) By trial-and-error, find the smallest value of b that can be used and still meet the design specifications for the same values of M, K, V, and D. bmin = Use the data cursor to label the peak value of deceleration. (2) (25%) Execute the MATLAB code provided for this assignment. What are the parameter values used in the code? M= 1000 K = 2000 V. = 24 D= 10 b= 1.2262e+03 For these parameter values, does the design meet the performance specifications? The design did meet the performance specifications Explain why or why not by showing and referring to the plot. Use the 'data cursor'. (3) (50%) By trial-and-error, find the smallest value of b that can be used and still meet the design specifications for the same values of M, K, V, and D. bmin = Use the data cursor to label the peak value of decelerationStep by Step Solution
There are 3 Steps involved in it
Step: 1

Get Instant Access to Expert-Tailored Solutions
See step-by-step solutions with expert insights and AI powered tools for academic success
Step: 2

Step: 3

Ace Your Homework with AI
Get the answers you need in no time with our AI-driven, step-by-step assistance
Get Started


