

Answered step by step
Verified Expert Solution
Question
1 Approved Answer
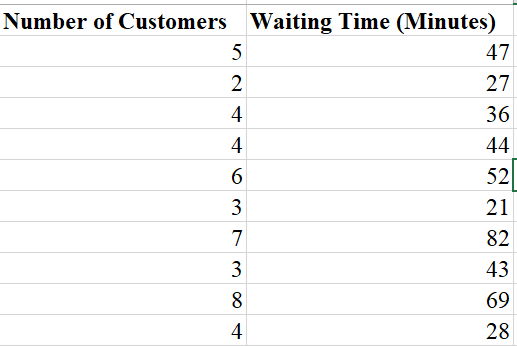
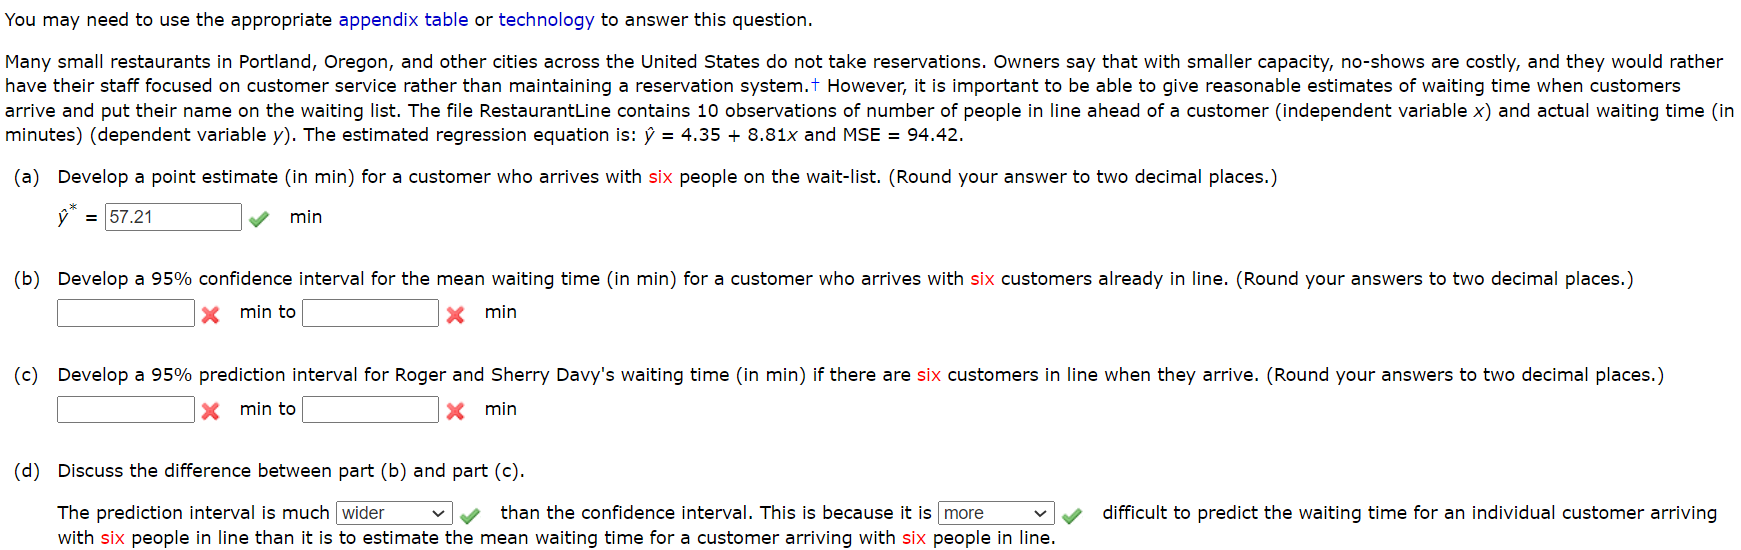
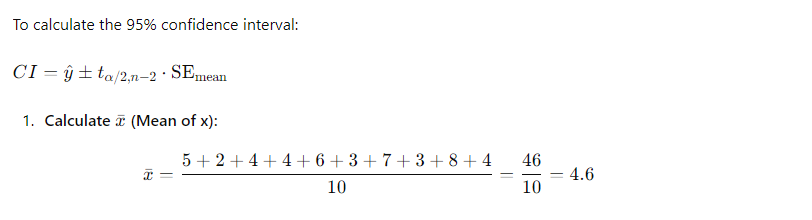
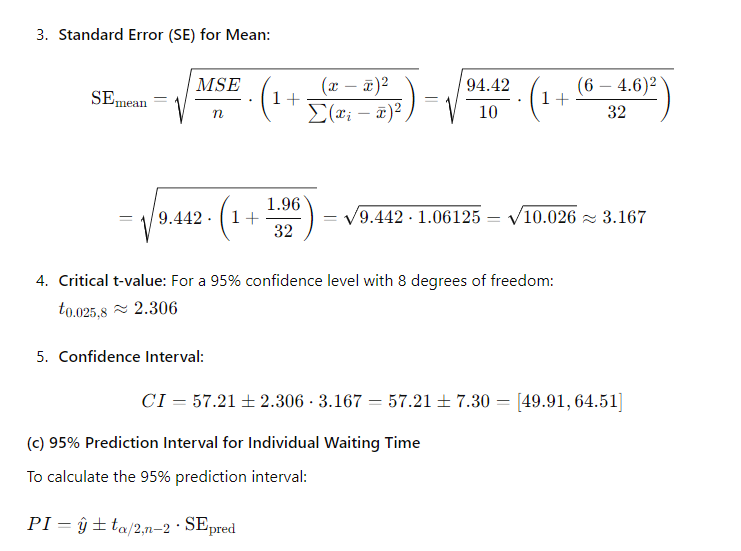
fYou may need to use the appropriate appendix table or technology to answer this question. Many small restaurants in Portland, Oregon, and other cities across
Step by Step Solution
There are 3 Steps involved in it
Step: 1

Get Instant Access to Expert-Tailored Solutions
See step-by-step solutions with expert insights and AI powered tools for academic success
Step: 2

Step: 3
Ace Your Homework with AI
Get the answers you need in no time with our AI-driven, step-by-step assistance
Get Started
Differential Equations and Linear Algebra
Authors: Jerry Farlow, James E. Hall, Jean Marie McDill, Beverly H. West
2nd edition
131860615, 978-0131860612