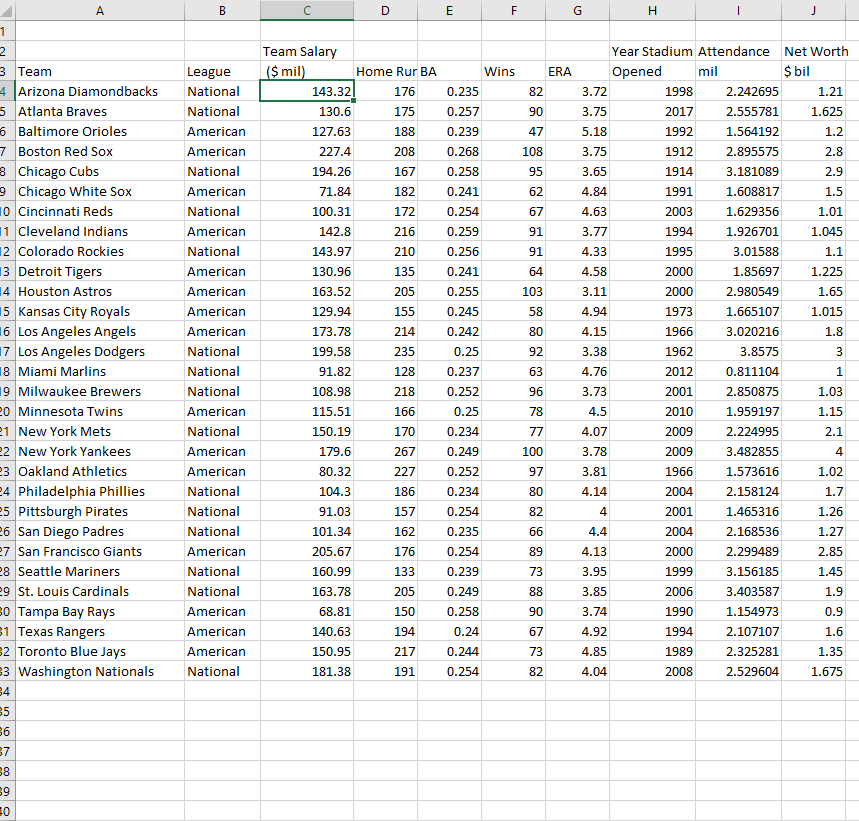
g) Conduct a test of hypothesis to determine whether the mean salary of the teams was different from $100.0 million. Use the 0.05 significance level. h) Using a 5% significance level, conduct a test of hypothesis to determine whether the mean attendance was more than 2,000,000 per team.A B C D E F G H Team Salary Year Stadium Attendance Net Worth Team League ($ mil) Home Rur BA Wins ERA Opened mil $ bil Arizona Diamondbacks National 143.32 176 0.235 82 3.72 1998 2.242695 1.21 Atlanta Braves National 130.6 175 0.257 90 3.75 2017 2.555781 1.625 Baltimore Orioles American 127.63 188 0.239 47 5.18 1992 1.564192 1.2 Boston Red Sox American 227.4 208 0.268 108 3.75 1912 2.895575 2.8 Chicago Cubs National 194.26 167 0.258 95 3.65 1914 3.181089 2.9 Chicago White Sox American 71.84 182 0.241 62 4.84 1991 1.608817 1.5 0 Cincinnati Reds National 100.31 172 0.254 67 4.63 2003 1.629356 1.01 1 Cleveland Indians American 142.8 216 0.259 91 3.77 1994 1.926701 1.045 National 143.97 210 4.33 1.1 Colorado Rockies 0.256 91 1995 3.01588 13 Detroit Tigers American 130.96 135 0.241 64 4.58 2000 1.85697 1.225 4 Houston Astros American 163.52 205 0.255 103 .11 2000 2.980549 1.65 5 Kansas City Royals American 129.94 155 0.245 58 1.94 1973 1.665107 1.015 6 Los Angeles Angels American 173.78 214 0.242 80 4.15 1966 3.020216 1.8 Los Angeles Dodgers National 199.58 235 0.25 92 .38 1962 3.8575 8 Miami Marlins National 91.82 128 0.237 63 4.76 2012 0.811104 9 Milwaukee Brewers National 108.98 218 0.252 96 3.73 2001 2.850875 1.03 0 Minnesota Twins American 115.51 166 0.25 78 4.5 2010 1.959197 1.15 1 New York Mets National 150.19 170 0.234 77 4.07 2009 2.224995 2.1 2 New York Yankees American 179.6 267 0.249 100 3.78 2009 3.482855 Oakland Athletics American 80.32 227 0.252 97 3.81 1966 1.573616 1.02 Philadelphia Phillies National 104.3 186 0.234 80 4.14 2004 2.158124 1.7 Pittsburgh Pirates National 91.03 157 0.254 82 2001 1.465316 1.26 16 San Diego Padres National 101.34 162 0.235 66 4.4 2004 2.168536 1.27 San Francisco Giants American 205.67 176 0.254 89 4.13 2000 2.299489 2.85 8 Seattle Mariners National 160.99 133 0.239 73 3.95 1999 3.156185 1.45 19 St. Louis Cardinals National 163.78 205 0.249 88 3.85 2006 3.403587 1.9 Tampa Bay Rays American 68.81 150 0.258 90 3.74 1990 1.154973 0.9 Texas Rangers American 140.63 194 0.24 67 4.92 1994 2.107107 1.6 2 Toronto Blue Jays American 150.95 217 0.244 73 4.85 1989 2.325281 1.35 $3 Washington Nationals National 181.38 191 0.254 82 4.04 2008 2.529604 1.675 16 18 19