g
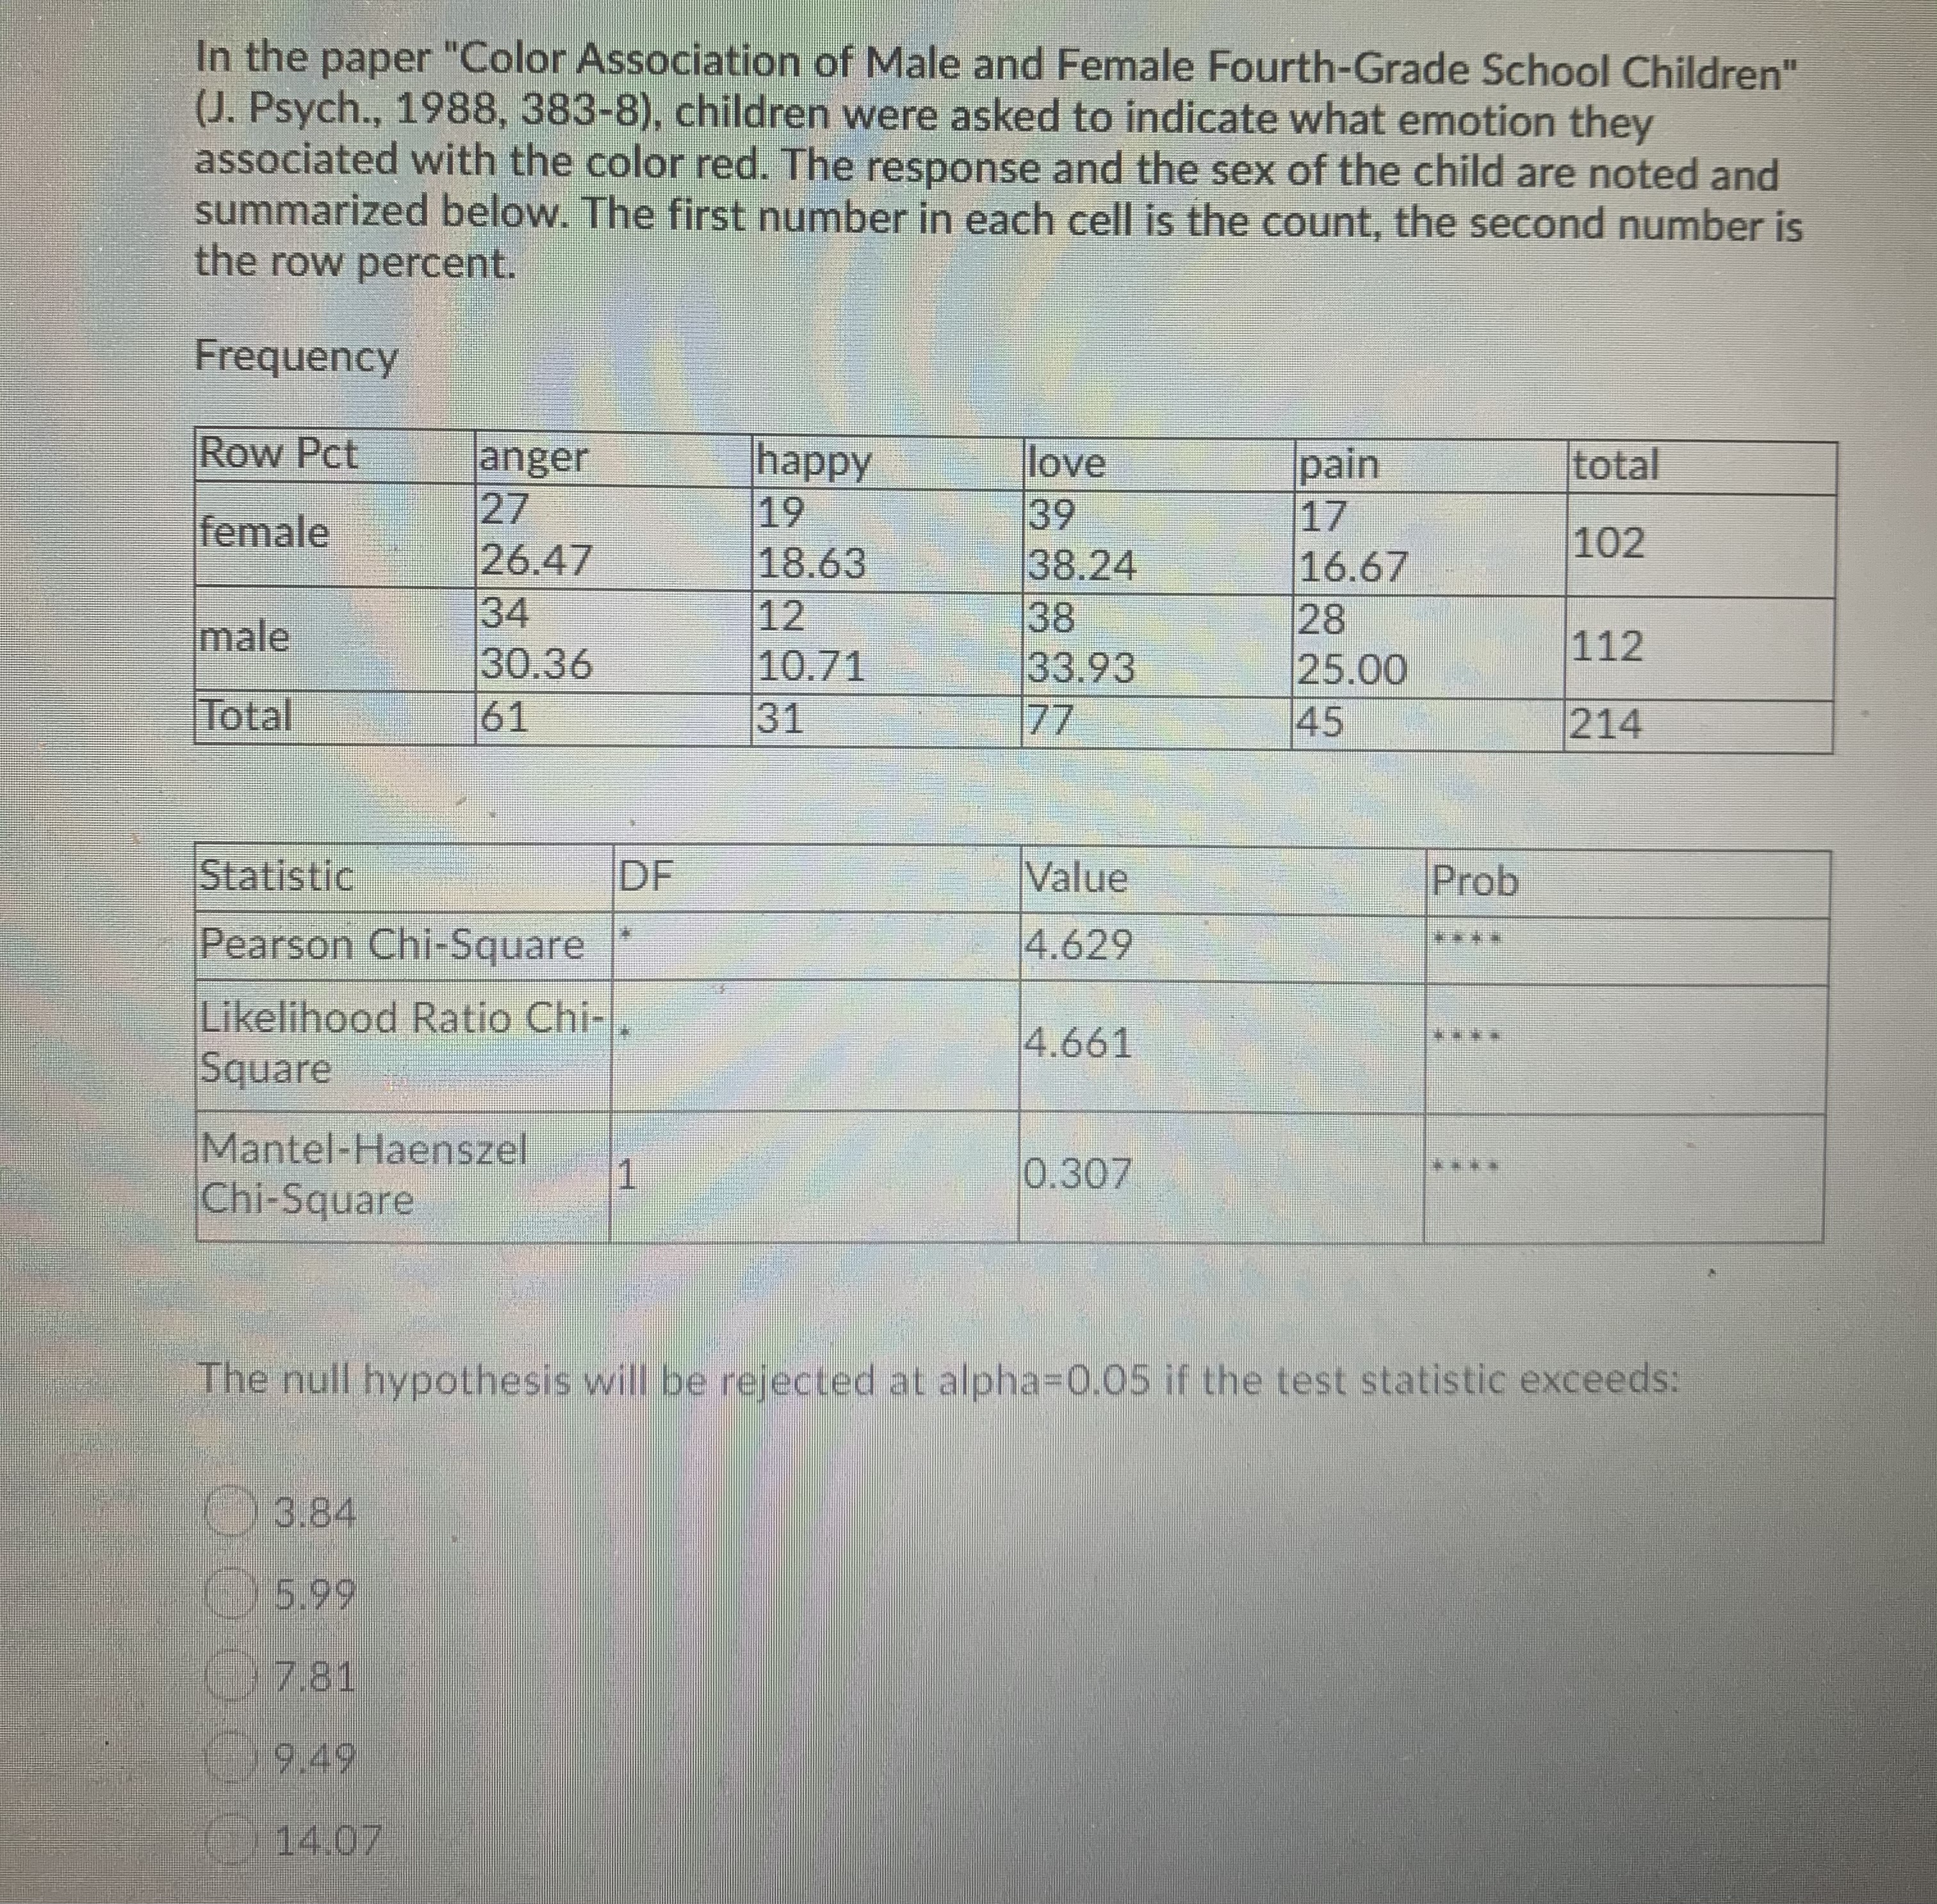
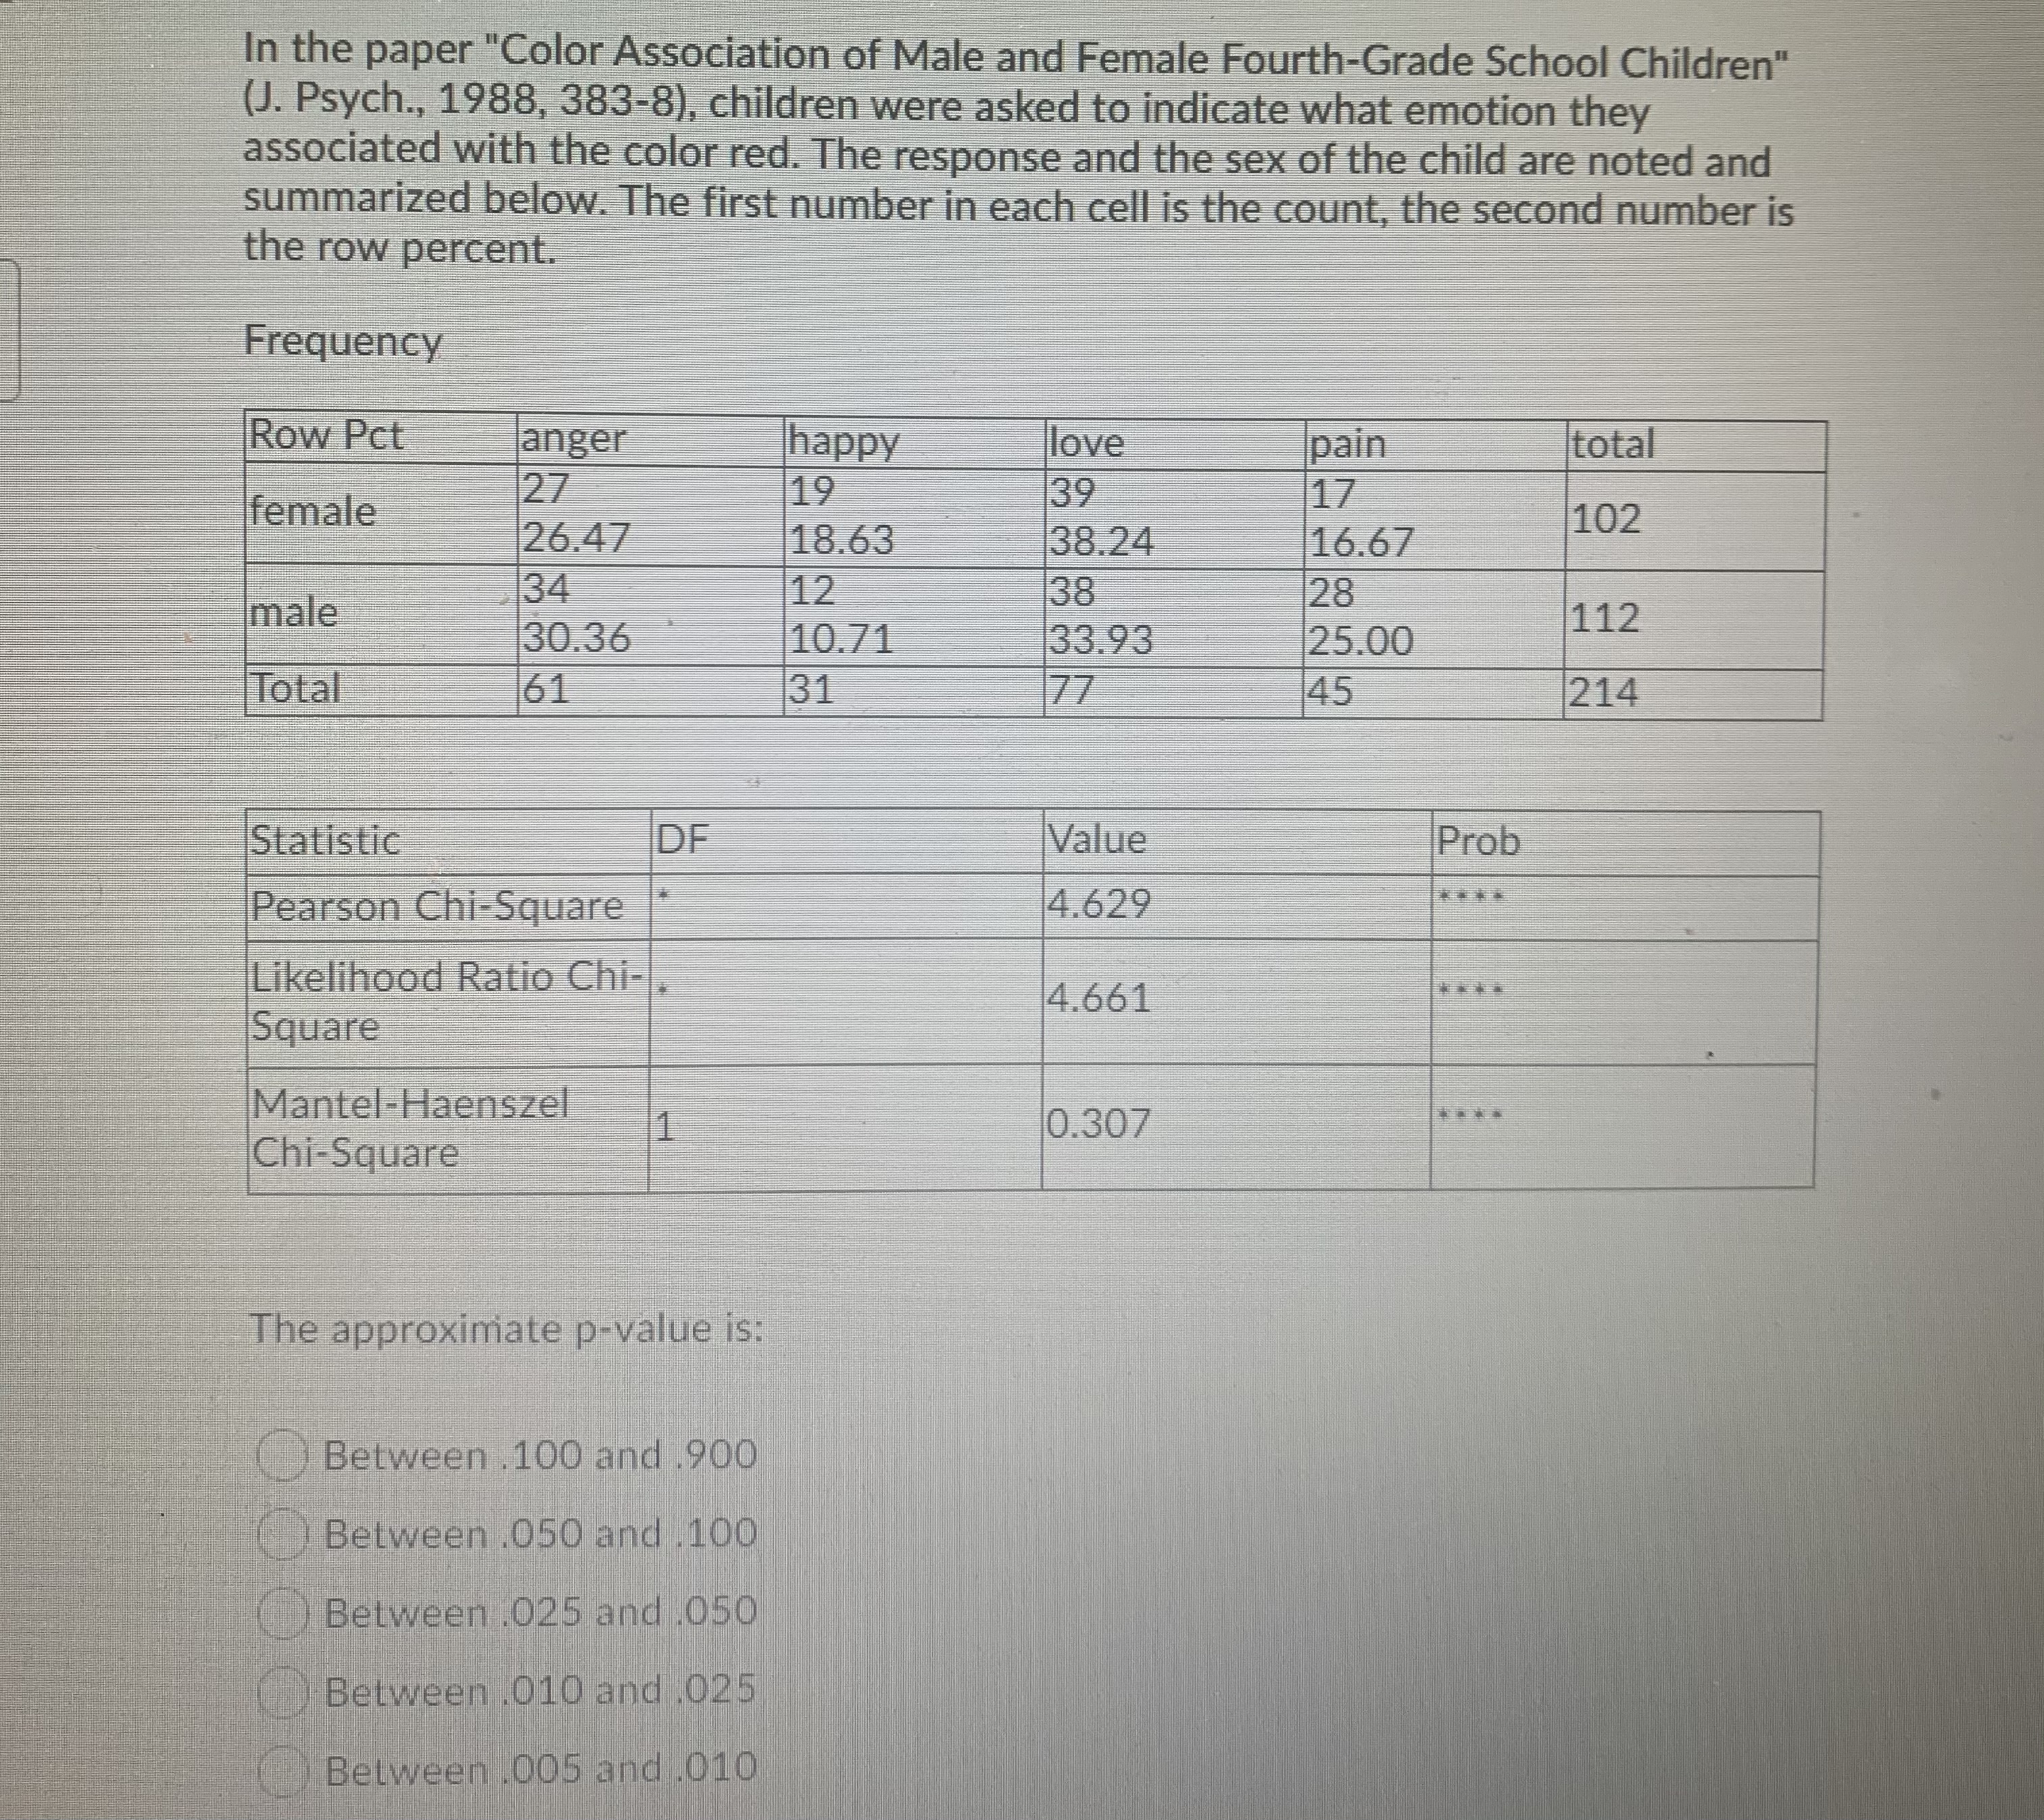
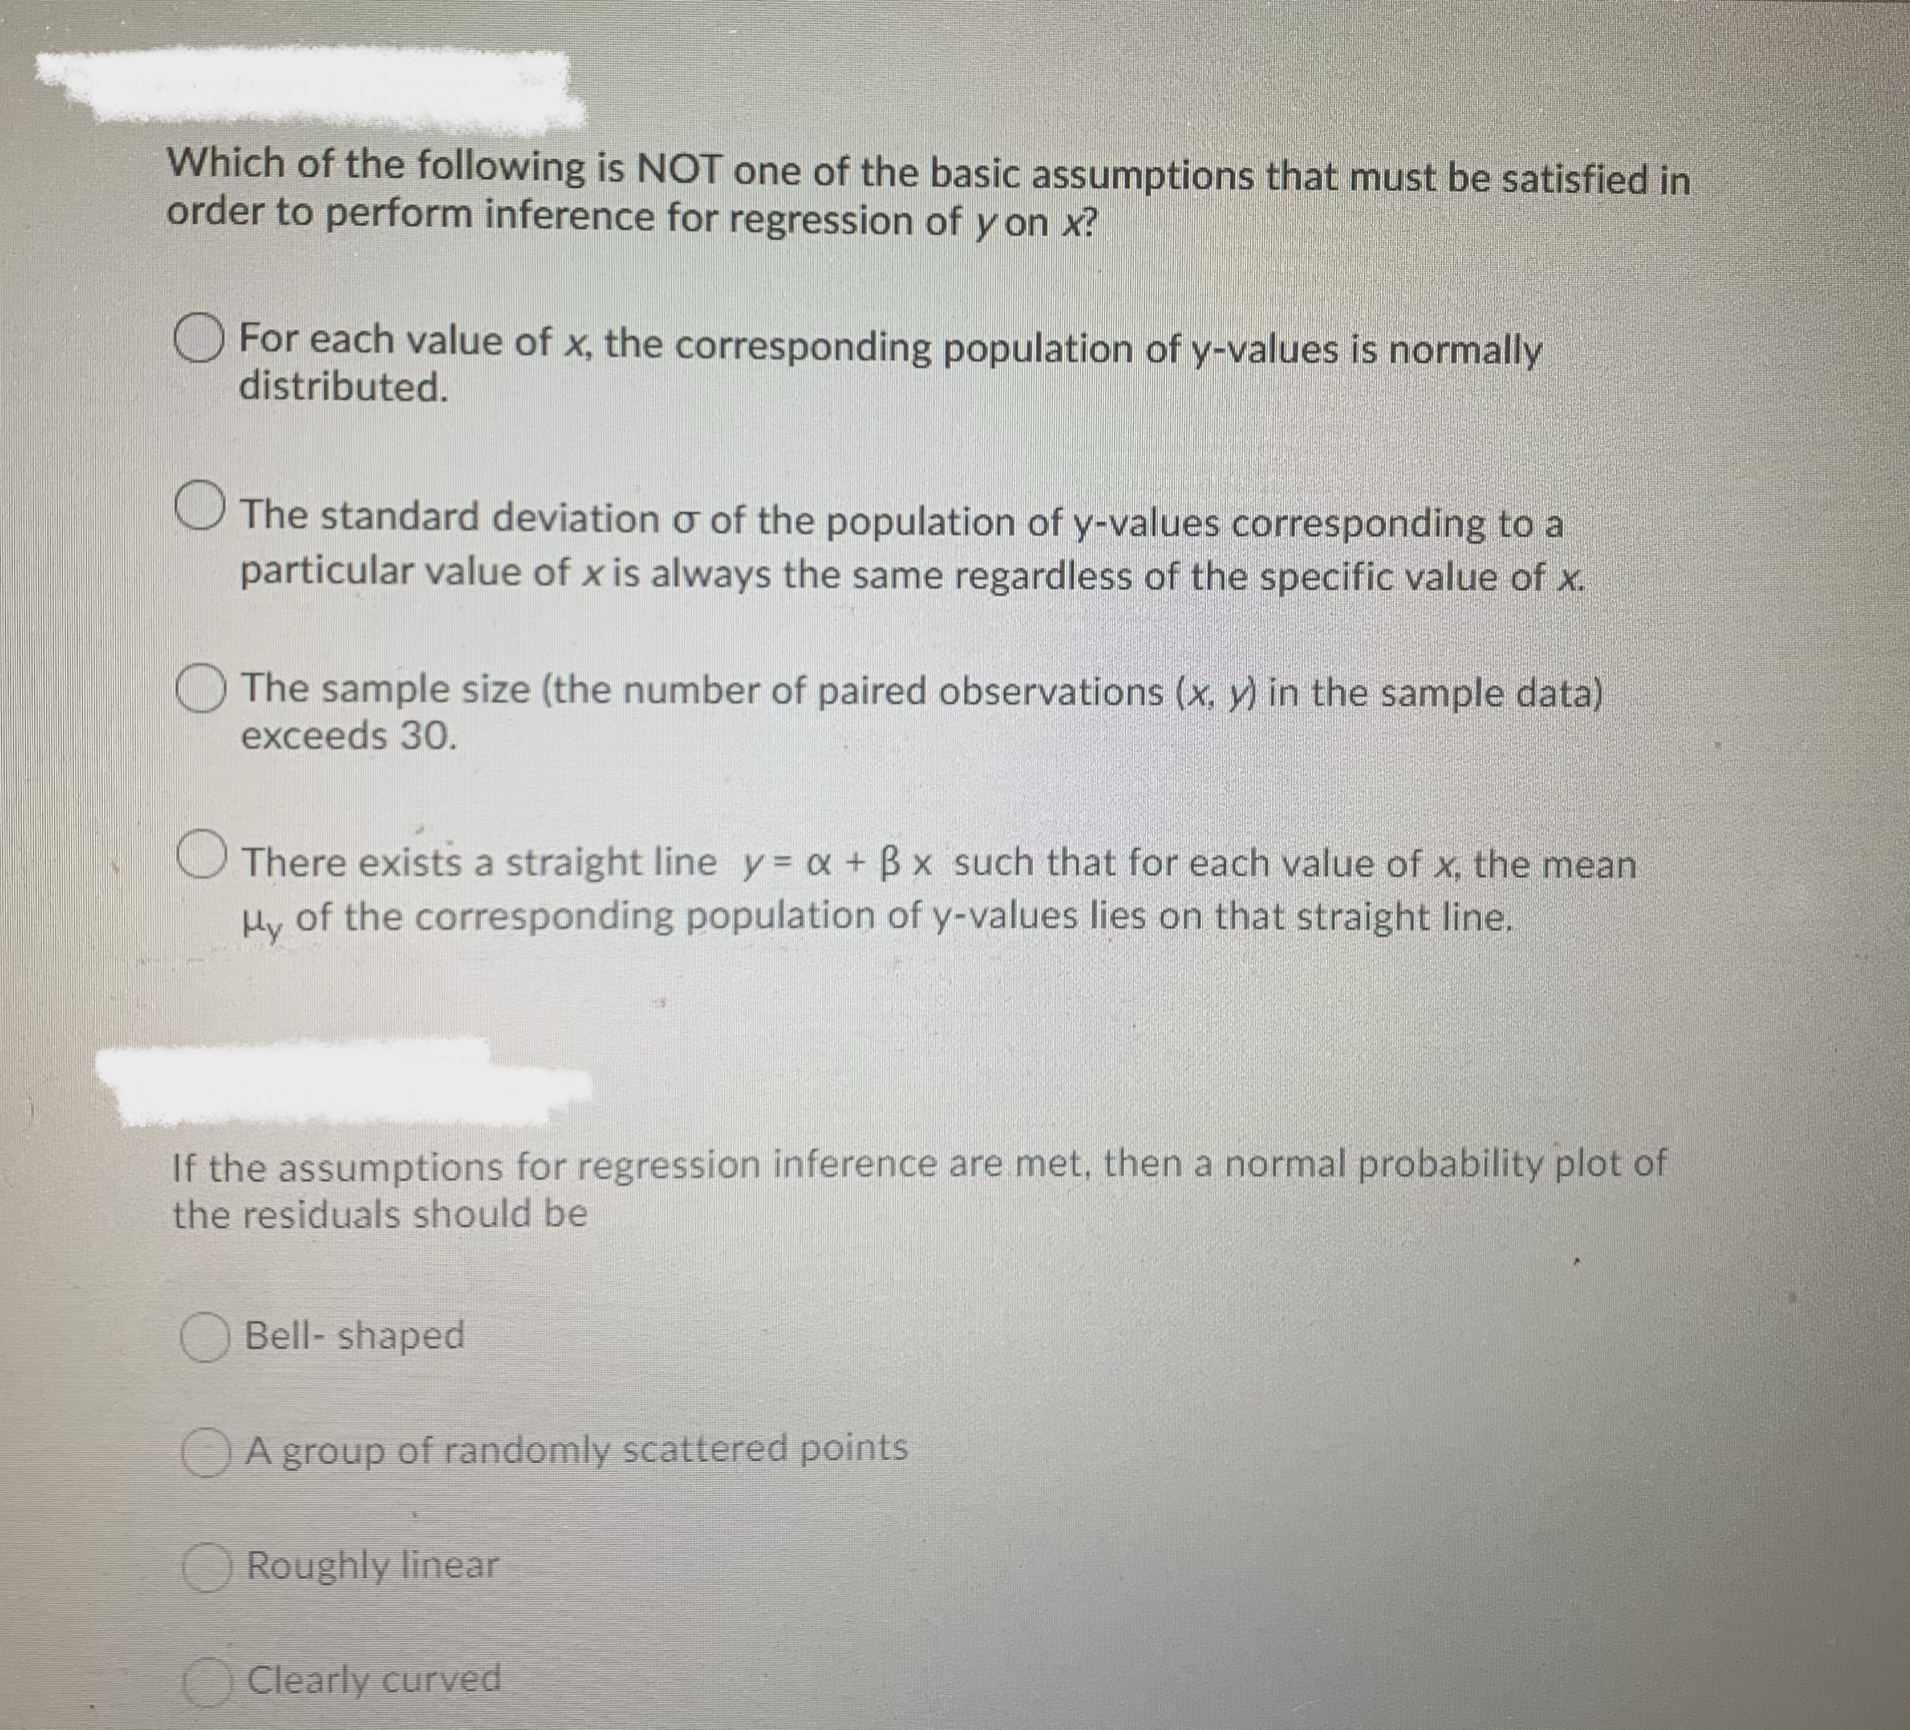
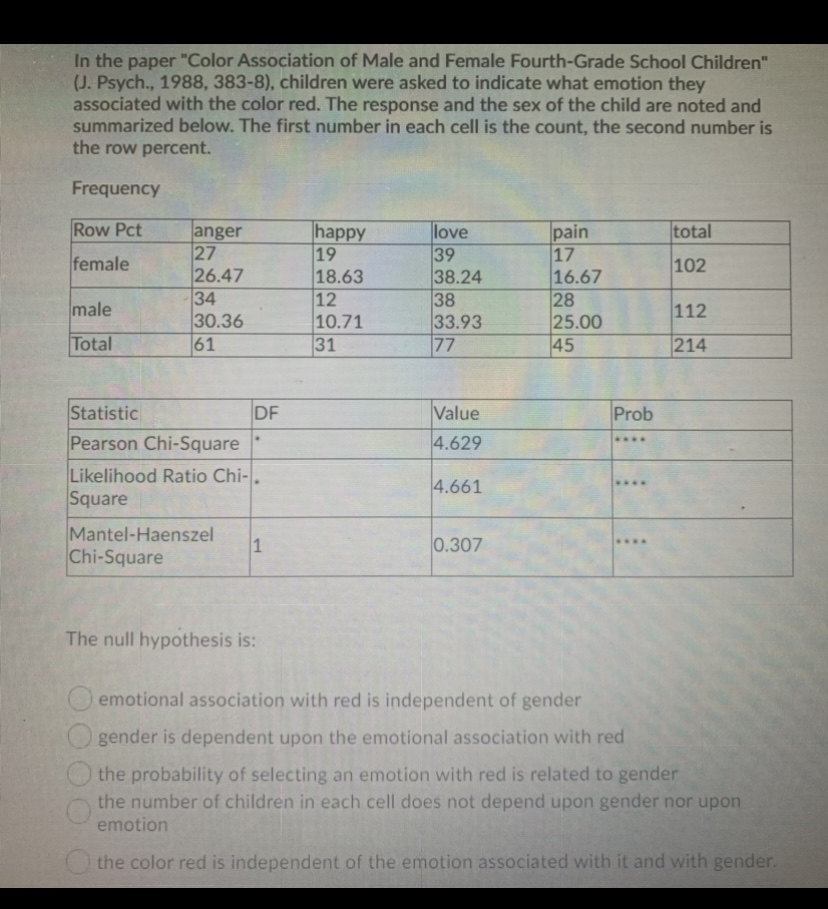
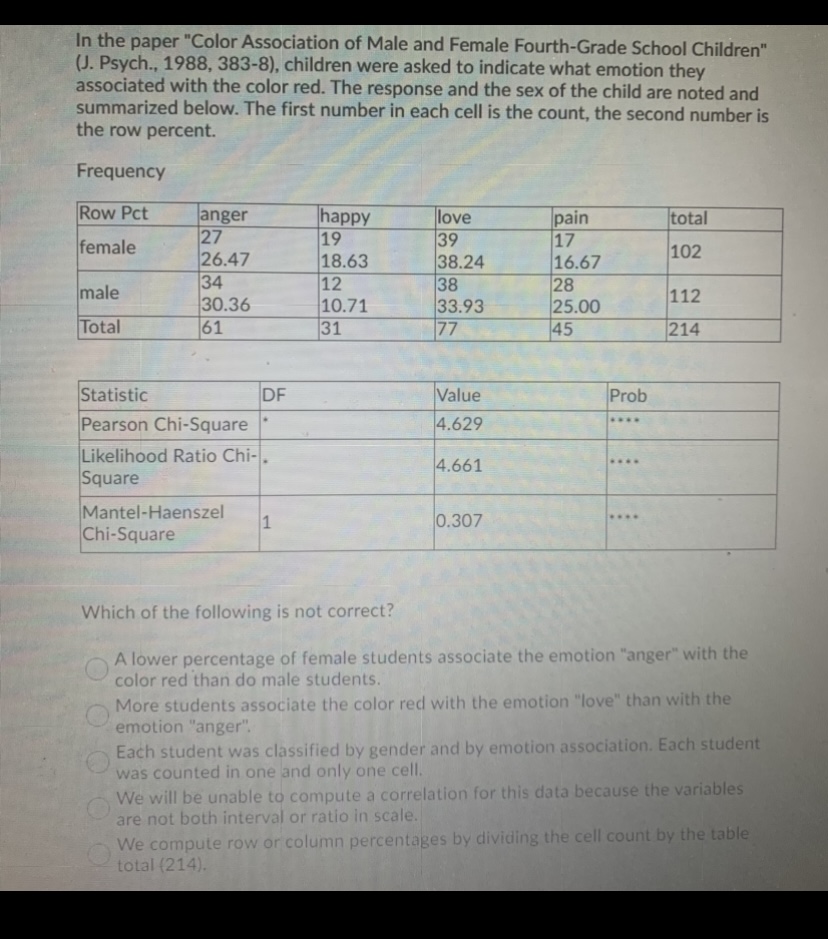
\fIn the paper "Color Association of Male and Female Fourth-Grade School Children" (J. Psych., 1988, 383-8), children were asked to indicate what emotion they associated with the color red. The response and the sex of the child are noted and summarized below. The first number in each cell is the count, the second number is the row percent. Frequency Row Pet anger happy love pain total female 27 19 39 17 26.47 18.63 38.24 16.67 102 34 male 12 38 28 30.36 10.71 33.93 25.00 112 Total 61 31 77 45 214 Statistic DF Value Prob Pearson Chi-Square 4.629 Likelihood Ratio Chi-. Square 4.661 Mantel-Haenszel Chi-Square 0.307 The approximate p-value is: Between . 100 and .900 Between .050 and . 100 O Between .025 and .050 O Between .010 and .025 Between .005 and .010Which of the following is NOT one of the basic assumptions that must be satisfied in order to perform inference for regression of y on x? For each value of x, the corresponding population of y-values is normally distributed. The standard deviation o of the population of y-values corresponding to a particular value of x is always the same regardless of the specific value of x. The sample size (the number of paired observations (x, y) in the sample data) exceeds 30. There exists a straight line y = & + B x such that for each value of x, the mean My of the corresponding population of y-values lies on that straight line. If the assumptions for regression inference are met, then a normal probability plot of the residuals should be Bell- shaped A group of randomly scattered points Roughly linear Clearly curvedIn the paper "Color Association of Male and Female Fourth-Grade School Children" (J. Psych., 1988, 383-8), children were asked to indicate what emotion they associated with the color red. The response and the sex of the child are noted and summarized below. The first number in each cell is the count, the second number is the row percent. Frequency Row Pct anger happy love pain total female 27 19 39 17 26.47 18.63 38.24 16.67 102 34 12 38 28 male 30.36 10.71 33.93 25.00 112 Total 61 31 77 45 214 Statistic DF Value Prob Pearson Chi-Square 4.629 . . . . Likelihood Ratio Chi-. 4.661 . . .. Square Mantel-Haenszel . . .. Chi-Square 1 0.307 The null hypothesis is: emotional association with red is independent of gender gender is dependent upon the emotional association with red the probability of selecting an emotion with red is related to gender O the number of children in each cell does not depend upon gender nor upon emotion the color red is independent of the emotion associated with it and with gender.In the paper "Color Association of Male and Female Fourth-Grade School Children" (J. Psych., 1988, 383-8), children were asked to indicate what emotion they associated with the color red. The response and the sex of the child are noted and summarized below. The first number in each cell is the count, the second number is the row percent. Frequency Row Pct anger happy love pain total female 27 19 39 17 26.47 18.63 38.24 16.67 102 34 male 12 38 28 30.36 10.71 33.93 25.00 112 Total 61 31 77 45 214 Statistic DF Value Prob Pearson Chi-Square 4.629 Likelihood Ratio Chi-. Square 4.661 . . . . Mantel-Haenszel 1 0.307 . . . Chi-Square Which of the following is not correct? O A lower percentage of female students associate the emotion "anger" with the color red than do male students. O More students associate the color red with the emotion "love" than with the emotion "anger". Each student was classified by gender and by emotion association. Each student was counted in one and only one cell. We will be unable to compute a correlation for this data because the variables are not both interval or ratio in scale. We compute row or column percentages by dividing the cell count by the table total (214)
