

Answered step by step
Verified Expert Solution
Question
1 Approved Answer
? Game Foul-Shooting Percentage Average Foul-Shooting Percentage Fill in the columns with Tyler's foul-shooting percentage for each game and their overall foul-shooting average after each
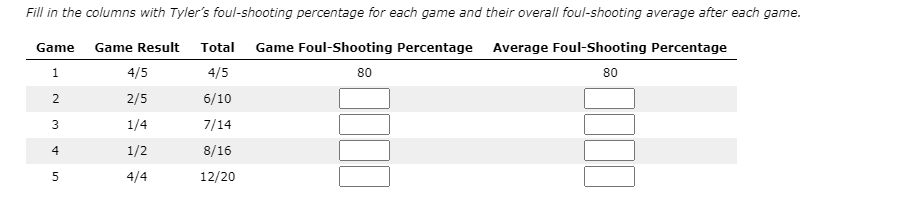
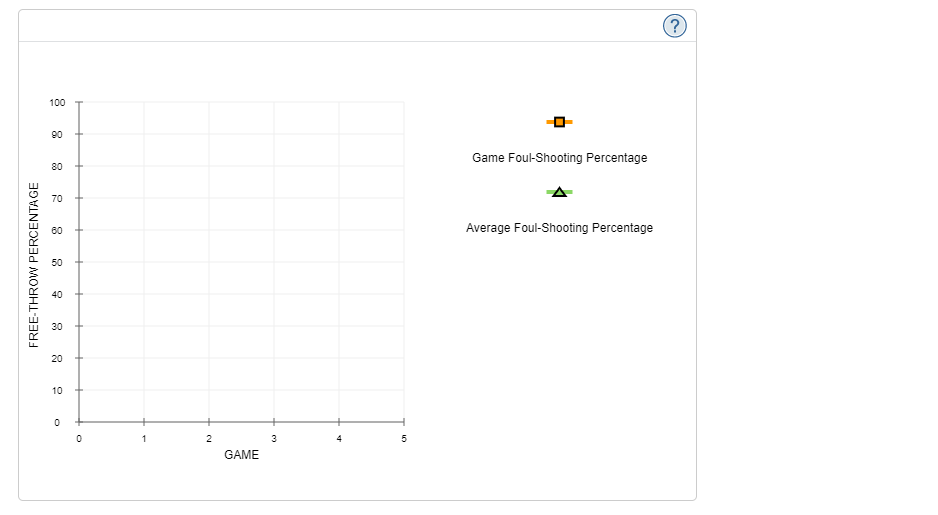
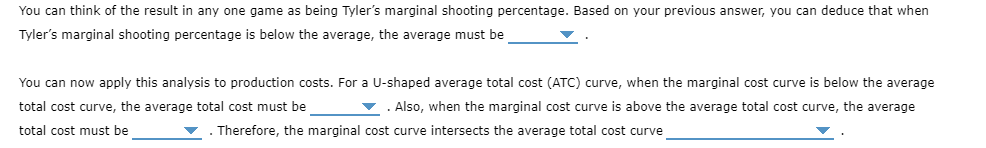 ? Game Foul-Shooting Percentage Average Foul-Shooting Percentage Fill in the columns with Tyler's foul-shooting percentage for each game and their overall foul-shooting average after each game. \begin{tabular}{ccccc} Game & Game Result & Total & Game Foul-Shooting Percentage & Average Foul-Shooting Percentage \\ \hline 1 & 4/5 & 4/5 & \\ 2 & 2/5 & 6/10 & \\ 3 & 1/4 & 7/14 & \\ 4 & 1/2 & 8/16 & \\ 5 & 4/4 & 12/20 & \end{tabular} You can think of the result in any one game as being Tyler's marginal shooting percentage. Based on your previous answer, you can deduce that when Tyler's marginal shooting percentage is below the average, the average must be You can now apply this analysis to production costs. For a U-shaped average total cost (ATC) curve, when the marginal cost curve is below the average total cost curve, the average total cost must be . Also, when the marginal cost curve is above the average total cost curve, the average total cost must be . Therefore, the marginal cost curve intersects the average total cost curve ? Game Foul-Shooting Percentage Average Foul-Shooting Percentage Fill in the columns with Tyler's foul-shooting percentage for each game and their overall foul-shooting average after each game. \begin{tabular}{ccccc} Game & Game Result & Total & Game Foul-Shooting Percentage & Average Foul-Shooting Percentage \\ \hline 1 & 4/5 & 4/5 & \\ 2 & 2/5 & 6/10 & \\ 3 & 1/4 & 7/14 & \\ 4 & 1/2 & 8/16 & \\ 5 & 4/4 & 12/20 & \end{tabular} You can think of the result in any one game as being Tyler's marginal shooting percentage. Based on your previous answer, you can deduce that when Tyler's marginal shooting percentage is below the average, the average must be You can now apply this analysis to production costs. For a U-shaped average total cost (ATC) curve, when the marginal cost curve is below the average total cost curve, the average total cost must be . Also, when the marginal cost curve is above the average total cost curve, the average total cost must be . Therefore, the marginal cost curve intersects the average total cost curve
 Step by Step Solution
There are 3 Steps involved in it
Step: 1

Get Instant Access to Expert-Tailored Solutions
See step-by-step solutions with expert insights and AI powered tools for academic success
Step: 2

Step: 3
Ace Your Homework with AI
Get the answers you need in no time with our AI-driven, step-by-step assistance
Get Started
2001 Miller Audit Procedures Miller Engagement
Authors: George Georgiades
1st Edition
0156071940, 978-0156071949