Question
Gary Loveman is CEO Caesars Entertainment. He believes that customer experience is absolutely crucial to the company?s success. In particular, ensuring sufficient front-desk staff in
Gary Loveman is CEO Caesars Entertainment. He believes that customer experience is absolutely crucial to the company?s success. In particular, ensuring sufficient front-desk staff in their hotels is critical to the customer experience. Therefore, he asked Ruben Sigala (chief analytics officer, senior vice president of Enterprise Analytics at Caesars Entertainment) to investigate this further. Sigala collected data showing that customers who had a bad check-in experience spent less at Caesars? restaurants, casinos, stores, and shows than those who had a good check-in experience. However, the ability to staff the front desks so that all customers had a good check-in experience (i.e., little wait time) was problematic due to the variability and volatility of guest arrival times. In this question, you will be investigating the check-ins at the Caesars hotel in Las Vegas, where revenue and profit growth had slowed considerably since 2008.
Each year in Las Vegas, Caesars checks in 3 million guests, at a cost of between $20 million and $25 million. The cost of staffing the front desks in Las Vegas averaged about $3 per occupied room. Caesars Palace and the Flamingo, two of the largest hotels in the world, might have as many as 16 to 20 front-desk personnel working at any given time. Sigala added, ?Overall, our goal is to have all guests checked in within roughly five minutes." An efficient front-desk employee checked in around 14 guests per hour, whereas an inefficient employee might process half that amount.
Sigala and his analytics team had been partnering with Caesars? central scheduling group to develop a model to forecast when guests would arrive. To translate the daily check-in forecast into the number of staff members needed at the front desk, Gene Lee (vice president Advanced Analytics) was asked to lead the modeling process. Lee divided the check-in forecast by 12 (to find how many total labor hours would be needed, assuming each front-desk employee could process 12 check-ins per hour), and then divided by 8 (to find out how many full-time employees (FTEs) would be needed, assuming each FTE worked eight hours per day). He then rounded that number to the closest integer to find the number of staff members per shift. If this number was less than nine, he increased it to nine, since Caesars Palace had a policy to have at least nine front-desk staff. This approach strongly relies on good forecasts for the number of check-ins.
Caesars? analytics group had gathered the number of check-ins per day for the previous three years. The analytics group divided the check-in data into two sets: a ?train? data set that was used to build each forecasting model and a ?validate? data set (or ?test? data set) that was used to determine how large the forecast error would have been if the forecasting model had been applied to the ?validate? data set. In this case, they used data from January 1, 2010, through December 31, 2012, as the ?train? data set, and the data from January 1, 2013, until the end of August 2013 as a validation data set.
Initially, the analytics team applied a moving average methodology to forecast guest arrivals. To capture the effect of day of week, Caesars implemented the moving average forecast based on the day of week. For example, the forecast for next Monday?s check-ins was the average of the number of check-ins on each of the three previous Mondays.
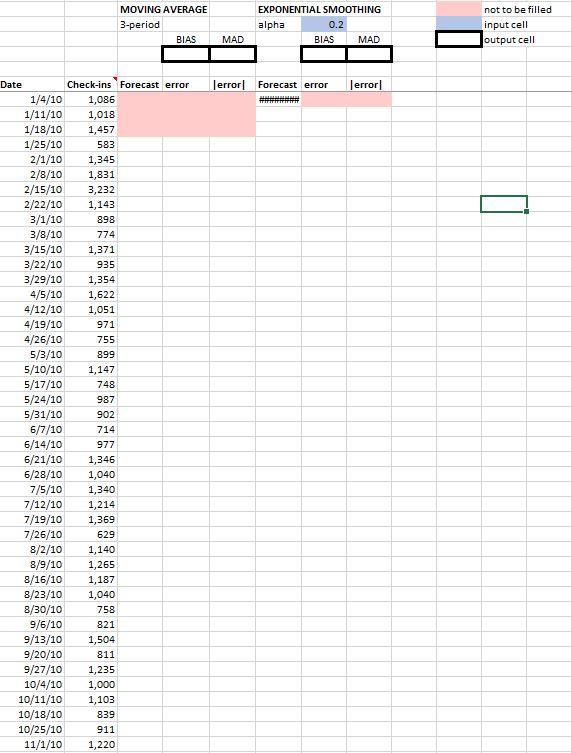
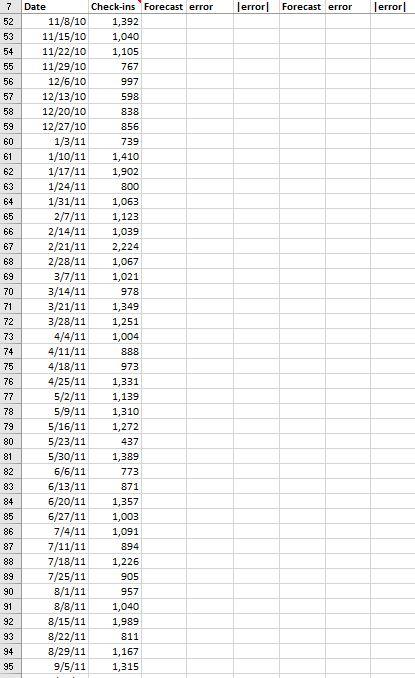
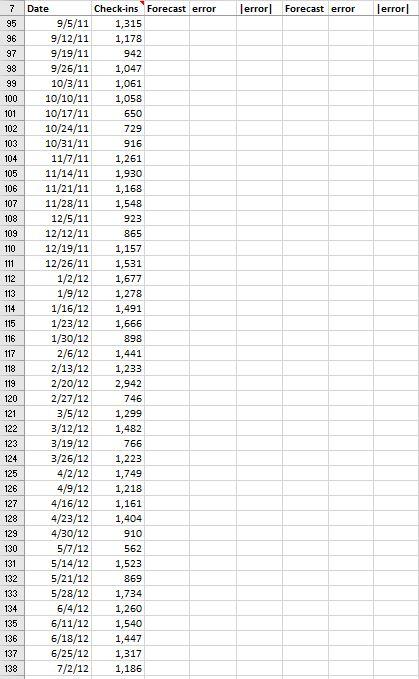
- Use the data in the worksheet ?Training set ? Mon? to test the performance of the moving average technique as described above. Report the bias and MAD. Note that this worksheet only shows the number of check-ins on Mondays over the 3-year training set.
- Use the data in the worksheet ?Training set ? Mon? to test the performance of an exponential smoothing forecasting technique where the smoothing factor ? is set to 0.2. Report the bias and MAD.
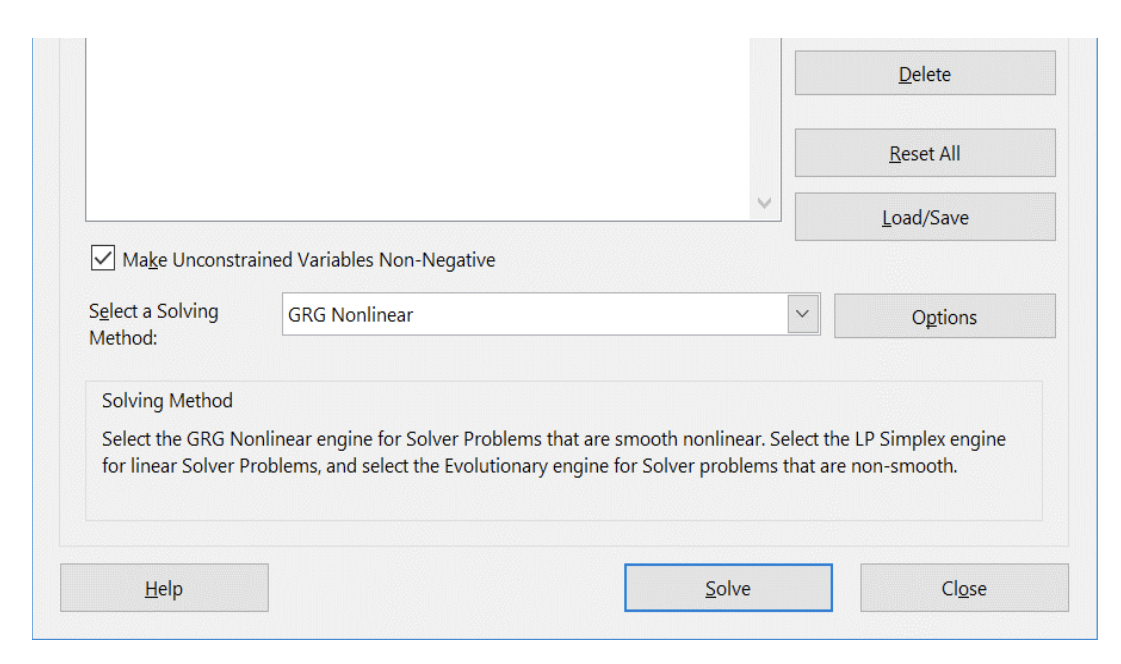
- Create a copy of your work in a new worksheet. Use optimization to find the best alpha that minimizes MAD, constraining your alpha to be between 0 and 0.3. Select GRC Nonlinear as the solving method.


![[error]Forecast errorerror713914014114214314414514614714814915015115215315415515615715815916016116](https://dsd5zvtm8ll6.cloudfront.net/si.experts.images/questions/2021/12/61b1d3cab55bc_04261b1d3cab522a.jpg)
 ?
?
Date 1/4/10 1,086 1/11/10 1,018 1/18/10 1,457 1/25/10 583 2/1/10 1,345 2/8/10 1,831 2/15/10 3,232 2/22/10 1,143 3/1/10 898 3/8/10 774 3/15/10 1,371 3/22/10 935 3/29/10 1,354 4/5/10 1,622 4/12/10 1,051 971 4/19/10 4/26/10 5/3/10 5/31/10 6/7/10 755 899 5/10/10 1,147 5/17/10 748 5/24/10 987 902 Check-ins Forecast error error Forecast error 714 977 6/14/10 6/21/10 1,346 6/28/10 1,040 7/5/10 1,340 7/12/10 1,214 7/19/10 1,369 7/26/10 629 8/2/10 1,140 8/9/10 1,265 8/16/10 1,187 8/23/10 1,040 8/30/10 9/6/10 9/13/10 1,504 9/20/10 811 758 821 9/27/10 1,235 10/4/10 1,000 10/11/10 1,103 839 MOVING AVERAGE 3-period 10/18/10 10/25/10 911 11/1/10 1,220 BIAS MAD EXPONENTIAL SMOOTHING alpha 0.2 BIAS MAD Jerror] not to be filled input cell output cell
Step by Step Solution
3.32 Rating (152 Votes )
There are 3 Steps involved in it
Step: 1
a and b 3 period moving average At1At2At33 where At actual value at time t BIAS s...
Get Instant Access to Expert-Tailored Solutions
See step-by-step solutions with expert insights and AI powered tools for academic success
Step: 2

Step: 3

Ace Your Homework with AI
Get the answers you need in no time with our AI-driven, step-by-step assistance
Get Started


