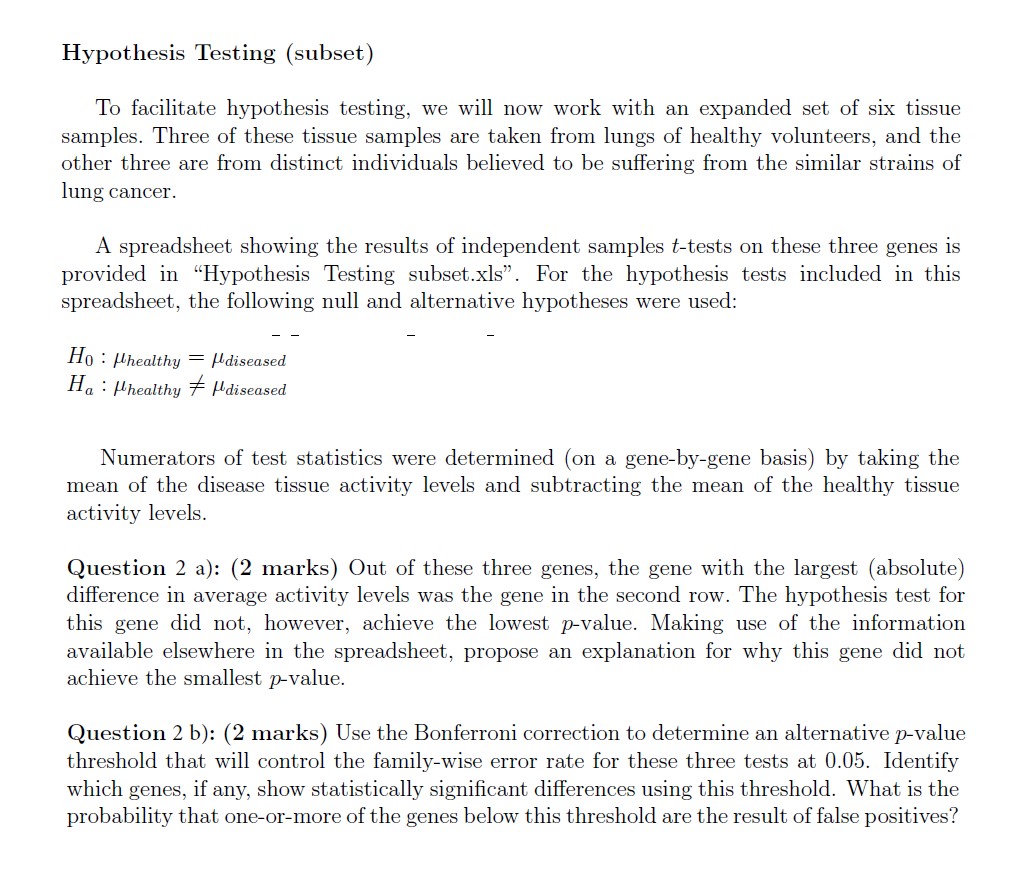
GENE Gene26 152.3 169.06 207.5533333 162.9966667 310 77 156.26 230.0833333 -44.55666667 73.82333333 6.488947013 5.291694751 minator 5.361613563 4.834199922 Numerator 13.00426597 8.121121296 546.1330109 4349.746912 142.0591999 3.844404383 -9.21696814 0.00092644 2667.201045 0.004465702Introduction In this project we'll explore some of the techniques that could be used to explore gene ex\" pression activity. As a motivating example, we'll imagine that we are comparing the gene activity in a healthy human lung tissue sample to the gene activity in a lung cancer tumor sample. We will attempt to identify genes that seem to be showing a change in activity in tumor tissue samples relative to healthy control samples. A quick primer on gene expression: while we won't dive too deeply into the underlying biology, the basic idea is that genes (DNA sequences) in the genome are transcribed into messenger RNA sequences, which are then used as blueprints to manufacture proteins (the biological molecules which carry out most cellular functions). When we reference \"gene ach tivity\" in this study, we are broadly addressing this process of taking instructions from the genome and using them to produce proteins for the cell. Each gene will have a baseline, quantitative activity level in healthy (lung) tissue the genes may be inactive / off, or active to some extent following a spectrum of values corresponding to how much protein product is ultimately produced. The numerical value associated with \"activity\" broadly captures the number of messenger RNAs and,! or proteins produced. This activity level often changes dramatically in cancerous tissues, and the focus of this study will be to explore some tech niques that are used to identify and study the genes that are behaving dierently in tumors based on their observed, numerical activity levels- Note: Genes work in complicated ways, and you shouldn't read too much into the meaning of a positive difference in activity versus a negative difference in activity. A drop in activity could result in less production of some compound, or in less production of something inhibiting production of that compound.[ The study will proceed in two phases: First, we will compare the gene activity levels for 40 handpicked genes across two samples (one healthy, one cancerous). These genes are suspected to be broadly involved in tumorigenesis and the onset of cancer, but we'll seek to conrm whether these genes are behaving differently in this strain of cancer specically. To do this, we will use a scatterplot and regression analysis to explore the overall trend in gene activity behaviour (and to provide a preliminary glimpse into the genes that may be showing dilferences in activity level). In the second phase of the study, we'll collect multiple replicate measurements from healthy and disease tissues, allowing us to conduct hypothesis tests to conrm the (statistical) signicance of any changes in activity level. We will rst do this focusing on a subset of the 40 candidates (those that seemed most suspicious from the scatterplot / regression analysis), and then using the complete set of 40 candidates. Because we will be conducting several hypothesis tests in the context of a single study, this will give us a chance to test out corrections for the multiple testing problem. Hypothesis Testing (subset) To facilitate hypothesis testing, we will now work with an expanded set of six tissue samples. Three of these tissue samples are taken from lungs of healthy volunteers, and the other three are from distinct individuals believed to be suering from the similar strains of lung cancer. A spreadsheet showing the results of independent samples ttests on these three genes is provided in \"Hypothesis Testing subsetxls\". For the hypothesis tests included in this spreadsheet, the following null and alternative hypotheses were used: H0 : Hhealthy : \"diseased Ha. : #healthy 7 \"diseased Numerators of test statistics were determined (on a gene-bygene basis) by taking the mean of the disease tissue activity levels and subtracting the mean of the healthy tissue activity levels. Question 2 a): (2 marks) Out of these three genes, the gene with the largest (absolute) difference in average activity levels was the gene in the second row. The hypothesis test for this gene did not, however, achieve the lowest pvalue. Making use of the information available elsewhere in the spreadsheet, propose an explanation for why this gene did not achieve the smallest pvalue. Question 2 b): (2 marks) Use the Bonferroni correction to determine an alternative p-value threshold that will control the familywise error rate for these three tests at 0.05. Identify which genes, if any, show statistically signicant differences using this threshold. What is the probability that onesorarnore of the genes below this threshold are the result of false positives