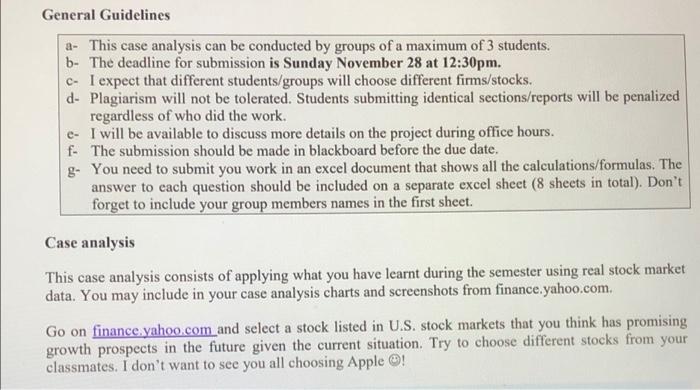
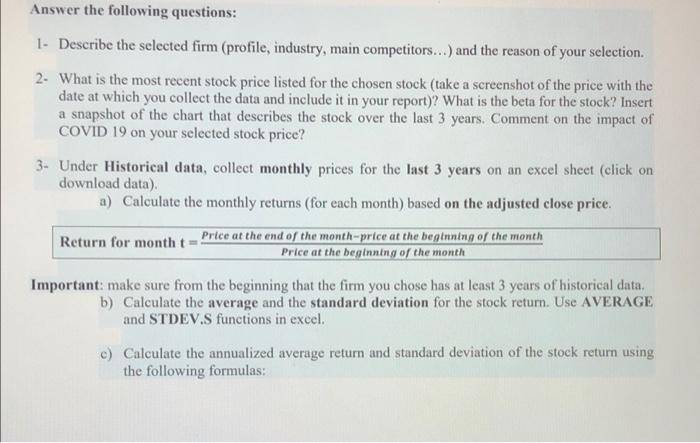
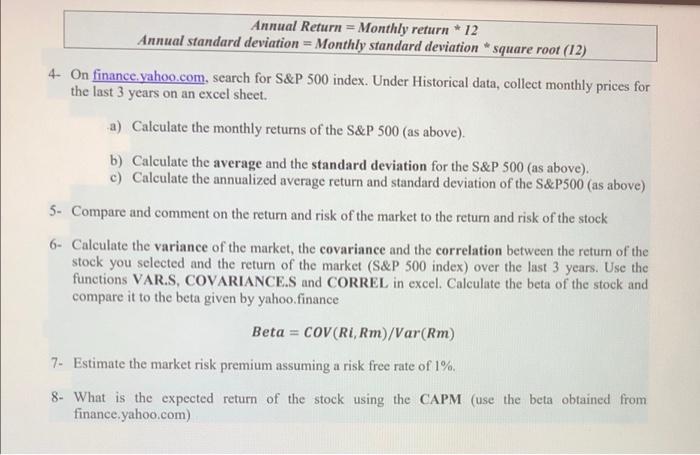
General Guidelines a- This case analysis can be conducted by groups of a maximum of 3 students. b- The deadline for submission is Sunday November 28 at 12:30pm. c- I expect that different students/groups will choose different firms/stocks. d- Plagiarism will not be tolerated. Students submitting identical sections/reports will be penalized regardless of who did the work. e- I will be available to discuss more details on the project during office hours. f. The submission should be made in blackboard before the due date. g. You need to submit you work in an excel document that shows all the calculations/formulas. The answer to each question should be included on a separate excel sheet (8 sheets in total). Don't forget to include your group members names in the first sheet. Case analysis This case analysis consists of applying what you have learnt during the semester using real stock market data. You may include in your case analysis charts and screenshots from finance.yahoo.com Go on finance yahoo.com and select a stock listed in U.S. stock markets that you think has promising growth prospects in the future given the current situation. Try to choose different stocks from your classmates. I don't want to see you all choosing Apple @! Answer the following questions: 1. Describe the selected firm (profile, industry, main competitors...) and the reason of your selection 2. What is the most recent stock price listed for the chosen stock (take a screenshot of the price with the date at which you collect the data and include it in your report)? What is the beta for the stock? Insert a snapshot of the chart that describes the stock over the last 3 years. Comment on the impact of COVID 19 on your selected stock price? 3. Under Historical data collect monthly prices for the last 3 years on an excel sheet (click on download data) a) Calculate the monthly returns (for each month) based on the adjusted close price. Return for month t Price at the end of the month-price at the beginning of the month Price at the beginning of the month Important: make sure from the beginning that the firm you chose has at least 3 years of historical data. b) Calculate the average and the standard deviation for the stock return. Use AVERAGE and STDEV.S functions in excel. c) Calculate the annualized average return and standard deviation of the stock return using the following formulas: Annual Return = Monthly return * 12 Annual standard deviation = Monthly standard deviation square root (12) 4- On finance.yahoo.com, search for S&P 500 index. Under Historical data, collect monthly prices for the last 3 years on an excel sheet. -a) Calculate the monthly returns of the S&P 500 (as above). b) Calculate the average and the standard deviation for the S&P 500 (as above). c) Calculate the annualized average return and standard deviation of the S&P500 (as above) 5- Compare and comment on the return and risk of the market to the return and risk of the stock 6- Calculate the variance of the market, the covariance and the correlation between the return of the stock you selected and the return of the market (S&P 500 index) over the last 3 years. Use the functions VAR.S, COVARIANCE.S and CORREL in excel. Calculate the beta of the stock and compare it to the beta given by yahoo finance Beta = COV(RI, Rm)/Var(Rm) 7- Estimate the market risk premium assuming a risk free rate of 1%. 8. What is the expected return of the stock using the CAPM (use the beta obtained from finance.yahoo.com) General Guidelines a- This case analysis can be conducted by groups of a maximum of 3 students. b- The deadline for submission is Sunday November 28 at 12:30pm. c- I expect that different students/groups will choose different firms/stocks. d- Plagiarism will not be tolerated. Students submitting identical sections/reports will be penalized regardless of who did the work. e- I will be available to discuss more details on the project during office hours. f. The submission should be made in blackboard before the due date. g. You need to submit you work in an excel document that shows all the calculations/formulas. The answer to each question should be included on a separate excel sheet (8 sheets in total). Don't forget to include your group members names in the first sheet. Case analysis This case analysis consists of applying what you have learnt during the semester using real stock market data. You may include in your case analysis charts and screenshots from finance.yahoo.com Go on finance yahoo.com and select a stock listed in U.S. stock markets that you think has promising growth prospects in the future given the current situation. Try to choose different stocks from your classmates. I don't want to see you all choosing Apple @! Answer the following questions: 1. Describe the selected firm (profile, industry, main competitors...) and the reason of your selection 2. What is the most recent stock price listed for the chosen stock (take a screenshot of the price with the date at which you collect the data and include it in your report)? What is the beta for the stock? Insert a snapshot of the chart that describes the stock over the last 3 years. Comment on the impact of COVID 19 on your selected stock price? 3. Under Historical data collect monthly prices for the last 3 years on an excel sheet (click on download data) a) Calculate the monthly returns (for each month) based on the adjusted close price. Return for month t Price at the end of the month-price at the beginning of the month Price at the beginning of the month Important: make sure from the beginning that the firm you chose has at least 3 years of historical data. b) Calculate the average and the standard deviation for the stock return. Use AVERAGE and STDEV.S functions in excel. c) Calculate the annualized average return and standard deviation of the stock return using the following formulas: Annual Return = Monthly return * 12 Annual standard deviation = Monthly standard deviation square root (12) 4- On finance.yahoo.com, search for S&P 500 index. Under Historical data, collect monthly prices for the last 3 years on an excel sheet. -a) Calculate the monthly returns of the S&P 500 (as above). b) Calculate the average and the standard deviation for the S&P 500 (as above). c) Calculate the annualized average return and standard deviation of the S&P500 (as above) 5- Compare and comment on the return and risk of the market to the return and risk of the stock 6- Calculate the variance of the market, the covariance and the correlation between the return of the stock you selected and the return of the market (S&P 500 index) over the last 3 years. Use the functions VAR.S, COVARIANCE.S and CORREL in excel. Calculate the beta of the stock and compare it to the beta given by yahoo finance Beta = COV(RI, Rm)/Var(Rm) 7- Estimate the market risk premium assuming a risk free rate of 1%. 8. What is the expected return of the stock using the CAPM (use the beta obtained from finance.yahoo.com)