

Question
Generate a forecast of the data in a chart and interpret the data forecast in findings. Gather historical stock price data for two companies. An
Generate a forecast of the data in a chart and interpret the data forecast in findings. Gather historical stock price data for two companies. An example of this data can be found at https://ca.finance.yahoo.com/quote/GGD.TO/history/ . Extract baseline data such as the daily price of the stock at close for 60 days. Complete this for both companies selected. Create an EXCEL file with the baseline data set on two different sheet tabs (One for each company). Generate a forecast for each company. Which one is better and why? Determine which of the six company stock forecasts are showing the most growth to further analyze via a direct comparison.Generate a forecast for each with a report on the findings. Which of the companies reviewed are the best investment based on the information at hand? Why?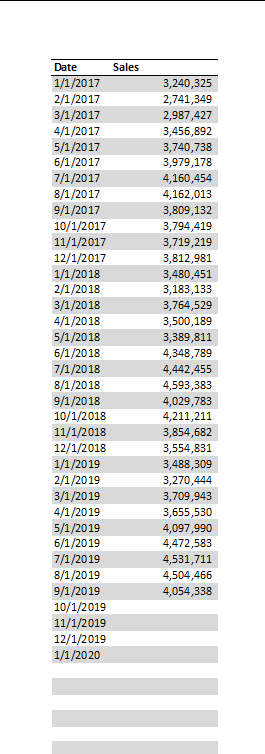
Step by Step Solution
There are 3 Steps involved in it
Step: 1

Get Instant Access to Expert-Tailored Solutions
See step-by-step solutions with expert insights and AI powered tools for academic success
Step: 2

Step: 3
Ace Your Homework with AI
Get the answers you need in no time with our AI-driven, step-by-step assistance
Get Started
Auditing Business Continuity Plans Assess And Improve Your Performance Against ISO 22301
Authors: John Silltow
2nd Edition
058074342X, 978-0580743429