

Answered step by step
Verified Expert Solution
Question
1 Approved Answer
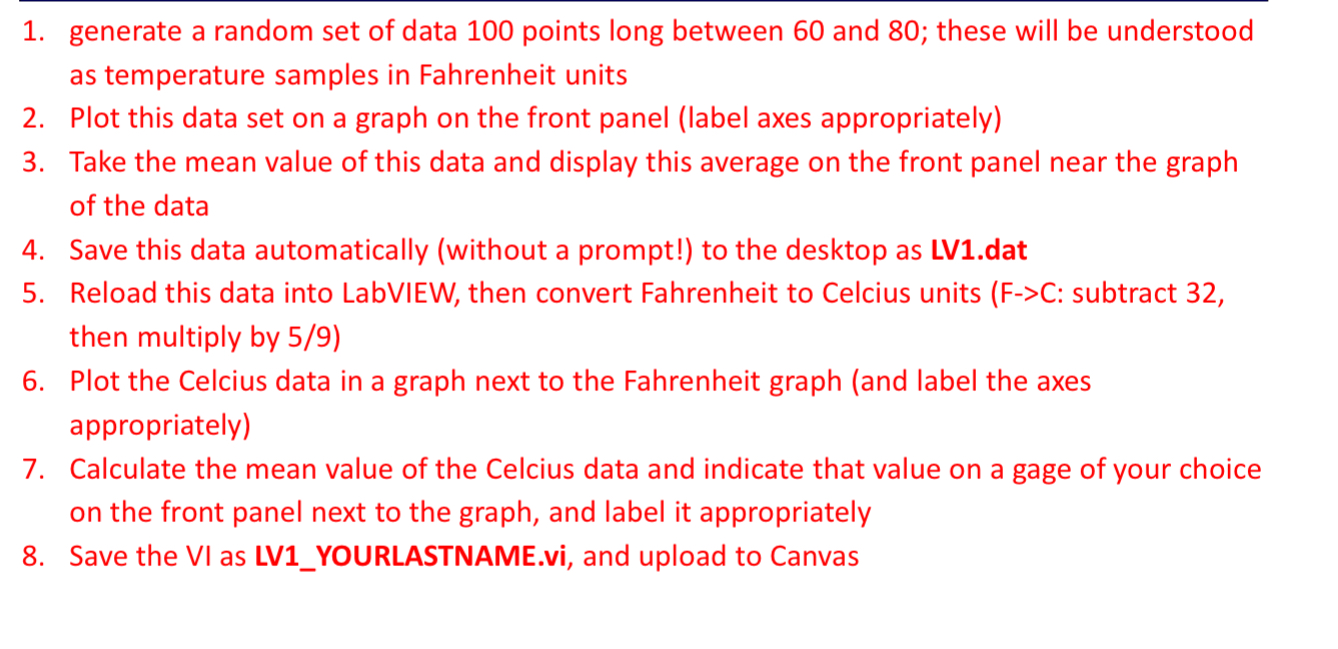
generate a random set of data 1 0 0 points long between 6 0 and 8 0 ; these will be understood as temperature samples
generate a random set of data points long between and ; these will be understood
as temperature samples in Fahrenheit units
Plot this data set on a graph on the front panel label axes appropriately
Take the mean value of this data and display this average on the front panel near the graph
of the data
Save this data automatically without a prompt! to the desktop as LVdat
Reload this data into LabVIEW, then convert Fahrenheit to Celcius units FC: subtract
then multiply by
Plot the Celcius data in a graph next to the Fahrenheit graph and label the axes
appropriately
Calculate the mean value of the Celcius data and indicate that value on a gage of your choice
on the front panel next to the gauge! Do this in LABVIEW, not MATLAB CODING LANGUAGE!
Step by Step Solution
There are 3 Steps involved in it
Step: 1

Get Instant Access to Expert-Tailored Solutions
See step-by-step solutions with expert insights and AI powered tools for academic success
Step: 2

Step: 3
Ace Your Homework with AI
Get the answers you need in no time with our AI-driven, step-by-step assistance
Get Started
Understanding Oracle APEX 5 Application Development
Authors: Edward Sciore
2nd Edition
1484209893, 9781484209899