

Answered step by step
Verified Expert Solution
Question
1 Approved Answer
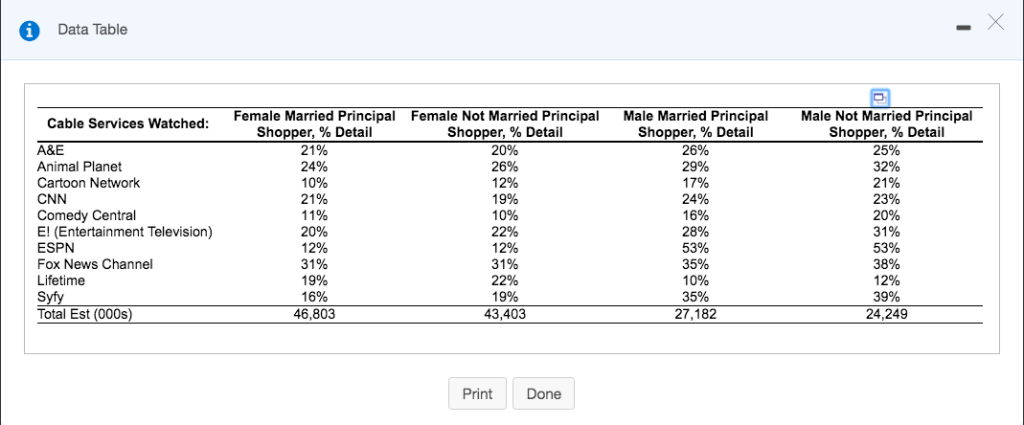
Getting the Message Out to the Shoppers Your company has just released to grocery stores a new cookie called Tastee Num Nums, and you believe
Step by Step Solution
There are 3 Steps involved in it
Step: 1

Get Instant Access to Expert-Tailored Solutions
See step-by-step solutions with expert insights and AI powered tools for academic success
Step: 2

Step: 3
Ace Your Homework with AI
Get the answers you need in no time with our AI-driven, step-by-step assistance
Get Started
Robonomics Prepare Today For The Jobless Economy Of Tomorrow
Authors: John Crews
1st Edition
1530910463, 978-1530910465