

Answered step by step
Verified Expert Solution
Question
1 Approved Answer
ght, which shows the percentages of adults from several 100 60- 40- 20- countries who favor building new nuclear power plants in their country.
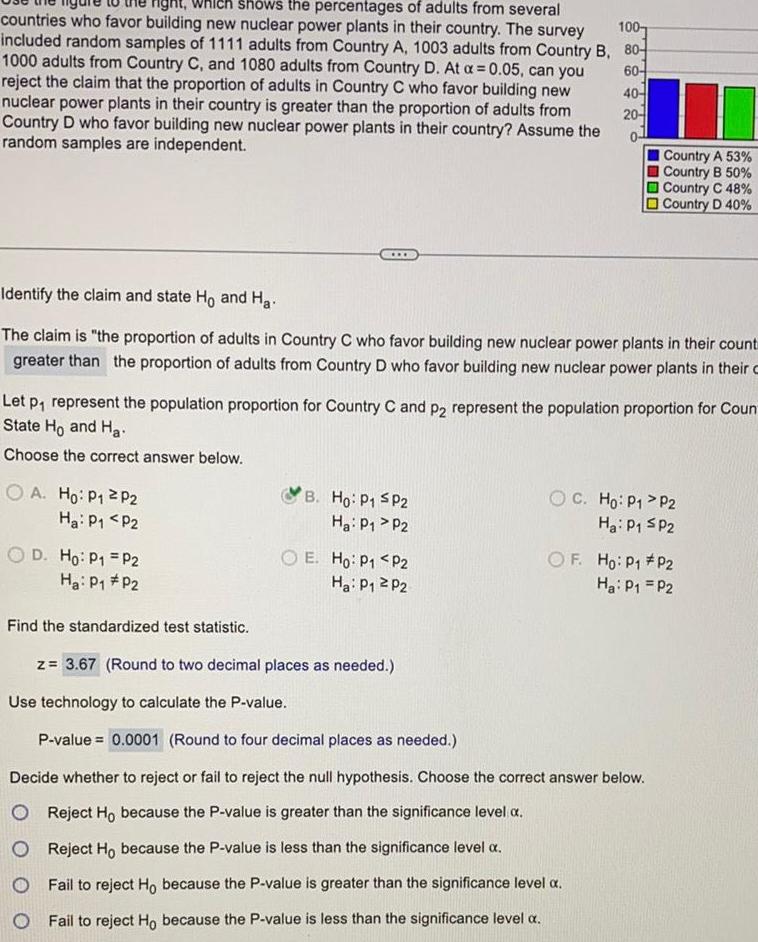
ght, which shows the percentages of adults from several 100 60- 40- 20- countries who favor building new nuclear power plants in their country. The survey included random samples of 1111 adults from Country A, 1003 adults from Country B, 80 1000 adults from Country C, and 1080 adults from Country D. At = 0.05, can you reject the claim that the proportion of adults in Country C who favor building new nuclear power plants in their country is greater than the proportion of adults from Country D who favor building new nuclear power plants in their country? Assume the random samples are independent. Country A 53% Country B 50% Country C 48% Country D 40% Identify the claim and state Ho and Ha The claim is "the proportion of adults in Country C who favor building new nuclear power plants in their count greater than the proportion of adults from Country D who favor building new nuclear power plants in their c Let p represent the population proportion for Country C and p2 represent the population proportion for Coun State Ho and Ha Choose the correct answer below. OA. Ho: P1 P2 B. Ho: P1 SP2 OC. Ho: P1 P2 Ha: P1 SP2 Ha P1 P2 Ha P1 P2 OD. Ho: P1 P2 Ha P1 P2 O E. Ho: P1 P2 Ha: P 2P2 OF. Ho: P1 P2 Ha P1 P2 Find the standardized test statistic. z= 3.67 (Round to two decimal places as needed.) Use technology to calculate the P-value. P-value = 0.0001 (Round to four decimal places as needed.) Decide whether to reject or fail to reject the null hypothesis. Choose the correct answer below. O Reject Ho because the P-value is greater than the significance level a. O Reject Ho because the P-value is less than the significance level a. O Fail to reject Ho because the P-value is greater than the significance level a. Fail to reject Ho because the P-value is less than the significance level a.
Step by Step Solution
There are 3 Steps involved in it
Step: 1

Get Instant Access to Expert-Tailored Solutions
See step-by-step solutions with expert insights and AI powered tools for academic success
Step: 2

Step: 3
Ace Your Homework with AI
Get the answers you need in no time with our AI-driven, step-by-step assistance
Get Started
Forecasting Time Series And Regression
Authors: Bruce L. Bowerman, Richard O'Connell, Anne Koehler
4th Edition
0534409776, 9780534409777