

give a clear summarise answer
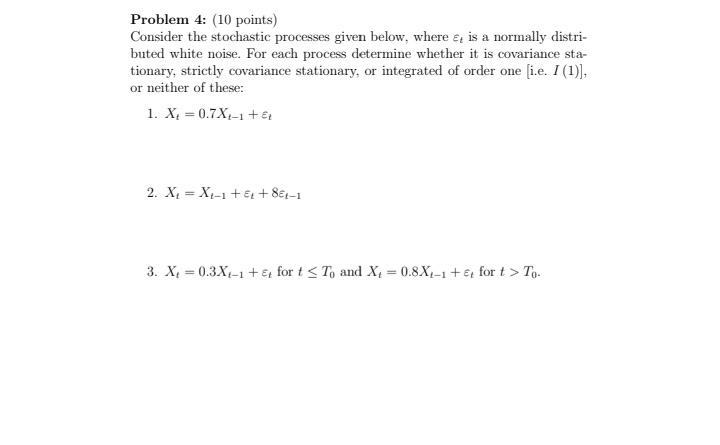
Problem 4: (10 points) Consider the stochastic processes given below, where &, is a normally distri- buted white noise. For each process determine whether it is covariance sta- tionary, strictly covariance stationary, or integrated of order one fi.e. / (1)], or neither of these: 1. Xt = 0.7X-1 + Et 2. Xt = X-1+ + 861-1 3. X, = 0.3X,-1 + , for t To.Problem 3: (10 points) Suppose that the joint distribution of the two random variables r and y is f(z, y) = de-(8+0)w(By)z where 3,0 > 0, y 2 0, x = 0, 1, 2, ... and a! denotes 1 . 2 . ... . I. 1. (8 points) Find the maximum likelihood estimators for / and 0. 2. (2 points) Find the maximum likelihood estimator of 0/(3 + 0).individual dummies. To test the pooled restriction, we can use the F- test for the restriction that all these dummies are equal to each other. The F-test statistics is: 4. Compare the models in Table 2 and 3. What is the difference between them? Which is more restrictive? Explain how would you test for these restrictions and if possible perform the test. The fixed effect model (table 2) is more general. The random effects model (table 3) assumes that the individual effects are not correlated with the explanatory variables. To test this restriction, we could use the Hausmann test - under the null of no correlation, both the random (RE) and fixed effects (FE) estimators are consistent and the (RE) is more efficient; under the alternative RE is inconsistent, while FE is still consistent. The test statistics (which is asymptotically xk distributed) is:Econometrics - Exam 5 R-squared 0,983509 Mean dep. var. 11,71364 Adjusted R-squared 0,983458 S.D. dep. var. 0,607083 S.E. of regression 0,078080 Sum squared resid 5,901458 Durbin-Watson stat 1,445803 Unweighted Statistics including Random Effects R-squared 0,986028 Mean dep. var. 11,71364 Adjusted R-squared 0,985985 S.D. dep. var. 0,607083 S.E. of regression 0,071870 Sum squared resid 5,000071 Durbin-Watson stat 1,706445 1. Test the hypothesis that log(LAND) has no significant effect on milk production. Describe which model you use, what is the null hypothe sis, the test statistics and its distribution. Explain how you used the displayed output to form your conclusion. 2. Why is the variable log(LAND) not included in Table 2? 3. Compare the models in Table 1 and 2. What is the difference between them? Which is more restrictive? Explain how would you test for these restrictions and if possible perform the test. The pooled model (table 1) is more restrictive that the fixed effects model (table 2). In the pooled model there is a single constant that is common to all units. The fixed effect model replaces the constant with a set ofEconometrics - Exam Method: Pooled Least Squares Sample: 1993 1998 Included Observations: 6 Number of cross-sections used: 162 Total panel (balanced) observations: 972 variable Coefficient Std. Error t-Statistics Prob. LOG(COWS) 0,674705 0,032031 21,06433 0,0000 LOG(FEED) 0,396393 0,014944 26,52504 0,0000 fixed effects R-squared 0,986294 Mean dep. var. 11,71364 Adjusted R-squared 0,983529 S.D. dep. var. 0,607083 S.E. of regression 0,077914 Sum squared resid 4,905013 F-statistics 58142,43 Durbin-Watson stat 1,717733 Table 3: Random Effect Estimation Dep. Variable: LOG(MILK) Method: GLS (Variance Component) Sample: 1993 1998 Included Observations: 6 Number of cross-sections used: 162 Total panel (balanced) observations: 972 variable Coefficient Std. Error t-Statistics Prob. C 7,086916 0,057206 123,8852 0,0000 LOG(COWS) 0,657466 0,027075 24,28350 0,0000 LOG(LAND) 0,020818 0,023718 0,877749 0,3830 LOG (FEED) 0,410013 0,013630 30,08170 0,0000 GLS Transformed RegressionProblem 2: (20 points) The following tables give results for an annual data set for 162 farms overs the years 1993 to 1998. The variables are: MILK: milk output in liters per year COWS: number of cows LAND: land area, constant for each farm FEED: feed input Table 1 gives output of a pooled regression of log(MILK) on an intercept (C), log(COWS), log(LAND) and log(FEED). Table 2 gives output from a fixed effects regression where the estimated fixed effects are not reported, and Table 3 gives results from a random effects estimation: Table 1: Pooled Estimation Dep. Variable: LOG(MILK) Method: Least Squares Sample (adjusted): 1 972 Included observations: 972 after adjusting endpoints variable Coefficient Std. Error t-Statistics Prob. C 6,976457 0,040584 171,9009 0,0000 LOG(COWS) 0,600228 0,023564 25,49150 0,0000 LOG(LAND) 0,020668 0,014120 1.463763 0.1436 LOG(FEED) 0,455605 0,013712 33,22704 0,0000 R-squared 0,956152 Mean dep. var. 11,71364 Adjusted R-squared 0,956017 S.D. dep. var. 0,607083 S.E. of regression 0,127319 Sum squared resid 15,69139 F-statistics 7036,159 Durbin-Watson stat 0,573676 Table 2: Fixed Effects Estimation Dep. Variable: LOG(MILK)1. (8 points) Comparing regressions (1.4) and (1.5), and making use of the expressions for the OLS estimators of the intercept and slope coefficient in a simple regression model, demonstrate that b; = by and that bi = 0. 2. (4 points) Comparing regressions (1.4) and (1.5), demonstrate that Y = Y -Y. 3. (3 points) Demonstrate that the residuals in (1.5) are identical to the residuals in (1.4). 4. (5 points) Explain why, theoretically, the specification (1.5) of the se- cond researcher is incorrect and he should have fitted (1.6) Y* = b2X* not including a constant in his specification. If the second researcher had fitted (1.6) instead of (1.5), how would this have affected his esti- mator of 3,? Would dropping the unnecessary intercept lead to a gain in efficiency?Problem 1: (20 points) A sample of data consists of n observations on two variables, Y and X. The true model is Yi = Bi + 32X, + e;, (1.1) where S, and 32 are parameters and & is a disturbance term that satisfies the usual regression model assumptions. In view of the true model, Y = 3, + 3X +z, (1.2) where Y, X, and & are the sample means of Y, X, and e. Subtracting the second equation from the first, one obtains (1.3) Y" = BX; + ; where Y, = Y, - Y, Xi = Xi - X, and e; = &; - E. Note that, by construction, the sample means of Y"*, X*, and * are all equal to zero. One researcher fits (1.4 ) Y = by + byX" A second researcher fits (1.5) Y' = bj + bix [Note: The second researcher included an intercept in the specification.] In the following items, you must give mathematical proofs. Unsupported intuitive guesses will not earn credit