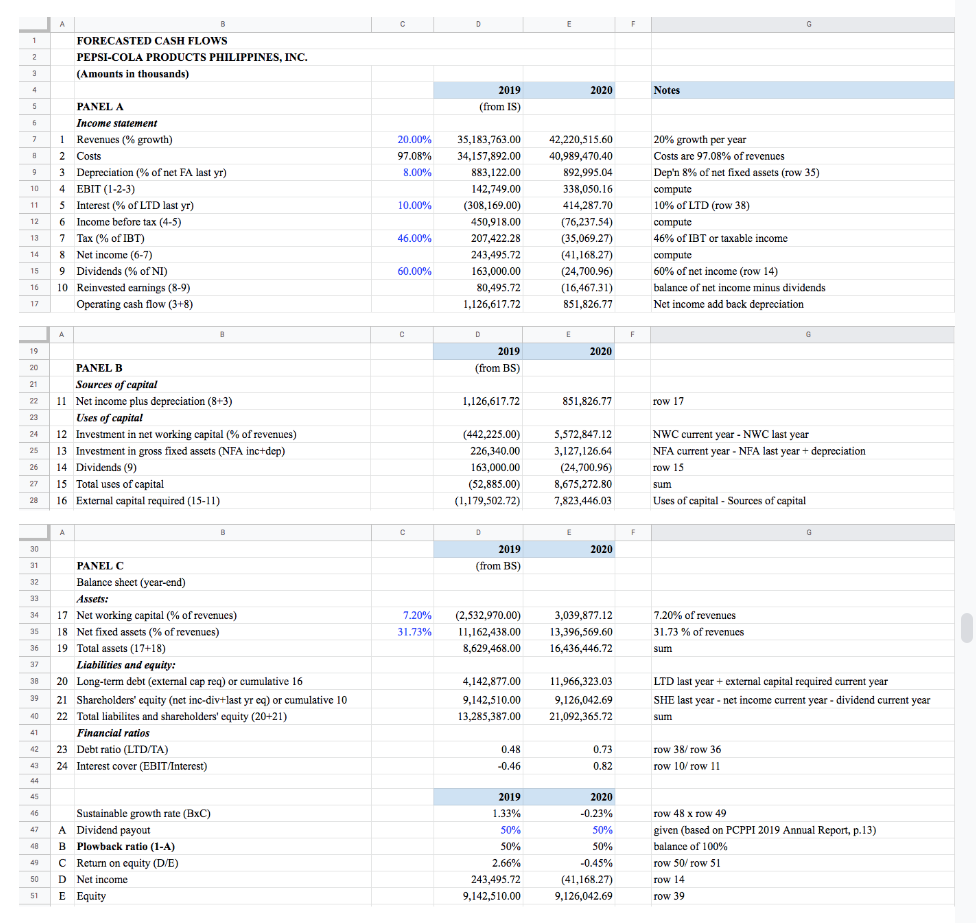
Give a financial plan analysis about this data. 
A D E F G 1 2 3 FORECASTED CASH FLOWS PEPSI-COLA PRODUCTS PHILIPPINES, INC. (Amounts in thousands) 4 2020 Notes 2019 (from IS) 5 6 7 20.00% 97.08% 8.00% 9 10 PANEL A Income statement 1 1 Revenues (% growth) 2 Costs 3 Depreciation (% of net FA last yr) 4 EBIT (1-2-3) 5 Interest (% of LTD last yr) 6 Income before tax (4-5) 7 Tax (% of IBT) 8 Net income (6-7) 9 Dividends (% of NI) 10 Reinvested earnings (8-9) Operating cash flow (378) 11 20% growth per year Costs are 97.08% of revenues Dep'n 8% of net fixed assets (row 35) compute 10% of LTD (row 38) compute 46% of IBT or taxable income 10.00% 35,183,763.00 34,157,892.00 883,122.00 142,749.00 (308,169.00) 450,918.00 207,422.28 243,495.72 163,000.00 80,495.72 1,126,617.72 12 42,220,515.60 40,989,470.40 892,995.04 338,050.16 414,287.70 (76,237.54) (35,069.27) (41,168.27) (24,700.96) (16,467.31) 851,826.77 13 46.00% 14. compute 15 60.00% 16 60% of net income (row 14) balance of net income minus dividends Net income add back depreciation 17 A F G G 19 D 2019 (from BS) 2020 20 21 1,126,617.72 851,826.77 row 17 22 90 23 24 PANEL B Sources of capital 11 Net income plus depreciation (8+3) Uses of capital 12 Investment in net working capital (% of revenues) 13 Investment in gross fixed assets (NFA inc+dep) 14 Dividends (9) 15 Total uses of capital 16 External capital required (15-11) 25 26 (442,225.00) 226,340.00 163,000.00 (52,885.00) (1,179,502.72) 5,572,847.12 3,127,126.64 (24,700.96) 8,675,272.80 7,823,446.03 NWC current year - NWC last year NFA current year - NFA last year + depreciation row 1S sum Uses of capital - Sources of capital 27 28 A B F G 30 2020 2019 (from BS) 31 32 34 7.20% 31.73% (2,532,970.00) 11,162,438.00 8,629,468.00 3,039,877.12 13,396,569.60 16,436,446.72 7.20% of revenues 31.73 % of revenues 36 sum PANEL C Balance sheet (year-end) Assets: 17 Net working capital (% of revenues) 18 Net fixed assets (% of revenues) 19 Total assets (17+18) Liabilities and equity: 20 Long-term debt (external cap req) or cumulative 16 21 Shareholders' equity (net inc-div+last yr eq) or cumulative 10 22 Total liabilites and shareholders' equity (20+21) Financial ratios 23 Debt ratio (LTD/TA) 24 Interest cover (EBIT/Interest) 38 39 4,142,877.00 9,142,510.00 13,285,387.00 11,966,323.03 9,126,042.69 21,092,365.72 LTD last year + external capital required current year SHE last year - net income current year - dividend current year sum 40 41 42 0.48 -0.46 0.73 0.82 row 38/ row 36 row 10/row 11 43 44 45 46 46 47 48 Sustainable growth rate (BxC) A Dividend payout B Plowback ratio (1-A) C Return on equity (D/E) D Net income E Equity 2019 1.33% 50% 50% 2.66% 243,495.72 9,142,510.00 2020 -0.23% 50% 50% -0.45% (41,168.27) 9,126,042.69 row 48 x row 49 given (based on PCPPI 2019 Annual Report, p.13) balance of 100% row 50/row 51 row 14 row 39 49 50 51 A D E F G 1 2 3 FORECASTED CASH FLOWS PEPSI-COLA PRODUCTS PHILIPPINES, INC. (Amounts in thousands) 4 2020 Notes 2019 (from IS) 5 6 7 20.00% 97.08% 8.00% 9 10 PANEL A Income statement 1 1 Revenues (% growth) 2 Costs 3 Depreciation (% of net FA last yr) 4 EBIT (1-2-3) 5 Interest (% of LTD last yr) 6 Income before tax (4-5) 7 Tax (% of IBT) 8 Net income (6-7) 9 Dividends (% of NI) 10 Reinvested earnings (8-9) Operating cash flow (378) 11 20% growth per year Costs are 97.08% of revenues Dep'n 8% of net fixed assets (row 35) compute 10% of LTD (row 38) compute 46% of IBT or taxable income 10.00% 35,183,763.00 34,157,892.00 883,122.00 142,749.00 (308,169.00) 450,918.00 207,422.28 243,495.72 163,000.00 80,495.72 1,126,617.72 12 42,220,515.60 40,989,470.40 892,995.04 338,050.16 414,287.70 (76,237.54) (35,069.27) (41,168.27) (24,700.96) (16,467.31) 851,826.77 13 46.00% 14. compute 15 60.00% 16 60% of net income (row 14) balance of net income minus dividends Net income add back depreciation 17 A F G G 19 D 2019 (from BS) 2020 20 21 1,126,617.72 851,826.77 row 17 22 90 23 24 PANEL B Sources of capital 11 Net income plus depreciation (8+3) Uses of capital 12 Investment in net working capital (% of revenues) 13 Investment in gross fixed assets (NFA inc+dep) 14 Dividends (9) 15 Total uses of capital 16 External capital required (15-11) 25 26 (442,225.00) 226,340.00 163,000.00 (52,885.00) (1,179,502.72) 5,572,847.12 3,127,126.64 (24,700.96) 8,675,272.80 7,823,446.03 NWC current year - NWC last year NFA current year - NFA last year + depreciation row 1S sum Uses of capital - Sources of capital 27 28 A B F G 30 2020 2019 (from BS) 31 32 34 7.20% 31.73% (2,532,970.00) 11,162,438.00 8,629,468.00 3,039,877.12 13,396,569.60 16,436,446.72 7.20% of revenues 31.73 % of revenues 36 sum PANEL C Balance sheet (year-end) Assets: 17 Net working capital (% of revenues) 18 Net fixed assets (% of revenues) 19 Total assets (17+18) Liabilities and equity: 20 Long-term debt (external cap req) or cumulative 16 21 Shareholders' equity (net inc-div+last yr eq) or cumulative 10 22 Total liabilites and shareholders' equity (20+21) Financial ratios 23 Debt ratio (LTD/TA) 24 Interest cover (EBIT/Interest) 38 39 4,142,877.00 9,142,510.00 13,285,387.00 11,966,323.03 9,126,042.69 21,092,365.72 LTD last year + external capital required current year SHE last year - net income current year - dividend current year sum 40 41 42 0.48 -0.46 0.73 0.82 row 38/ row 36 row 10/row 11 43 44 45 46 46 47 48 Sustainable growth rate (BxC) A Dividend payout B Plowback ratio (1-A) C Return on equity (D/E) D Net income E Equity 2019 1.33% 50% 50% 2.66% 243,495.72 9,142,510.00 2020 -0.23% 50% 50% -0.45% (41,168.27) 9,126,042.69 row 48 x row 49 given (based on PCPPI 2019 Annual Report, p.13) balance of 100% row 50/row 51 row 14 row 39 49 50 51


