Give answers
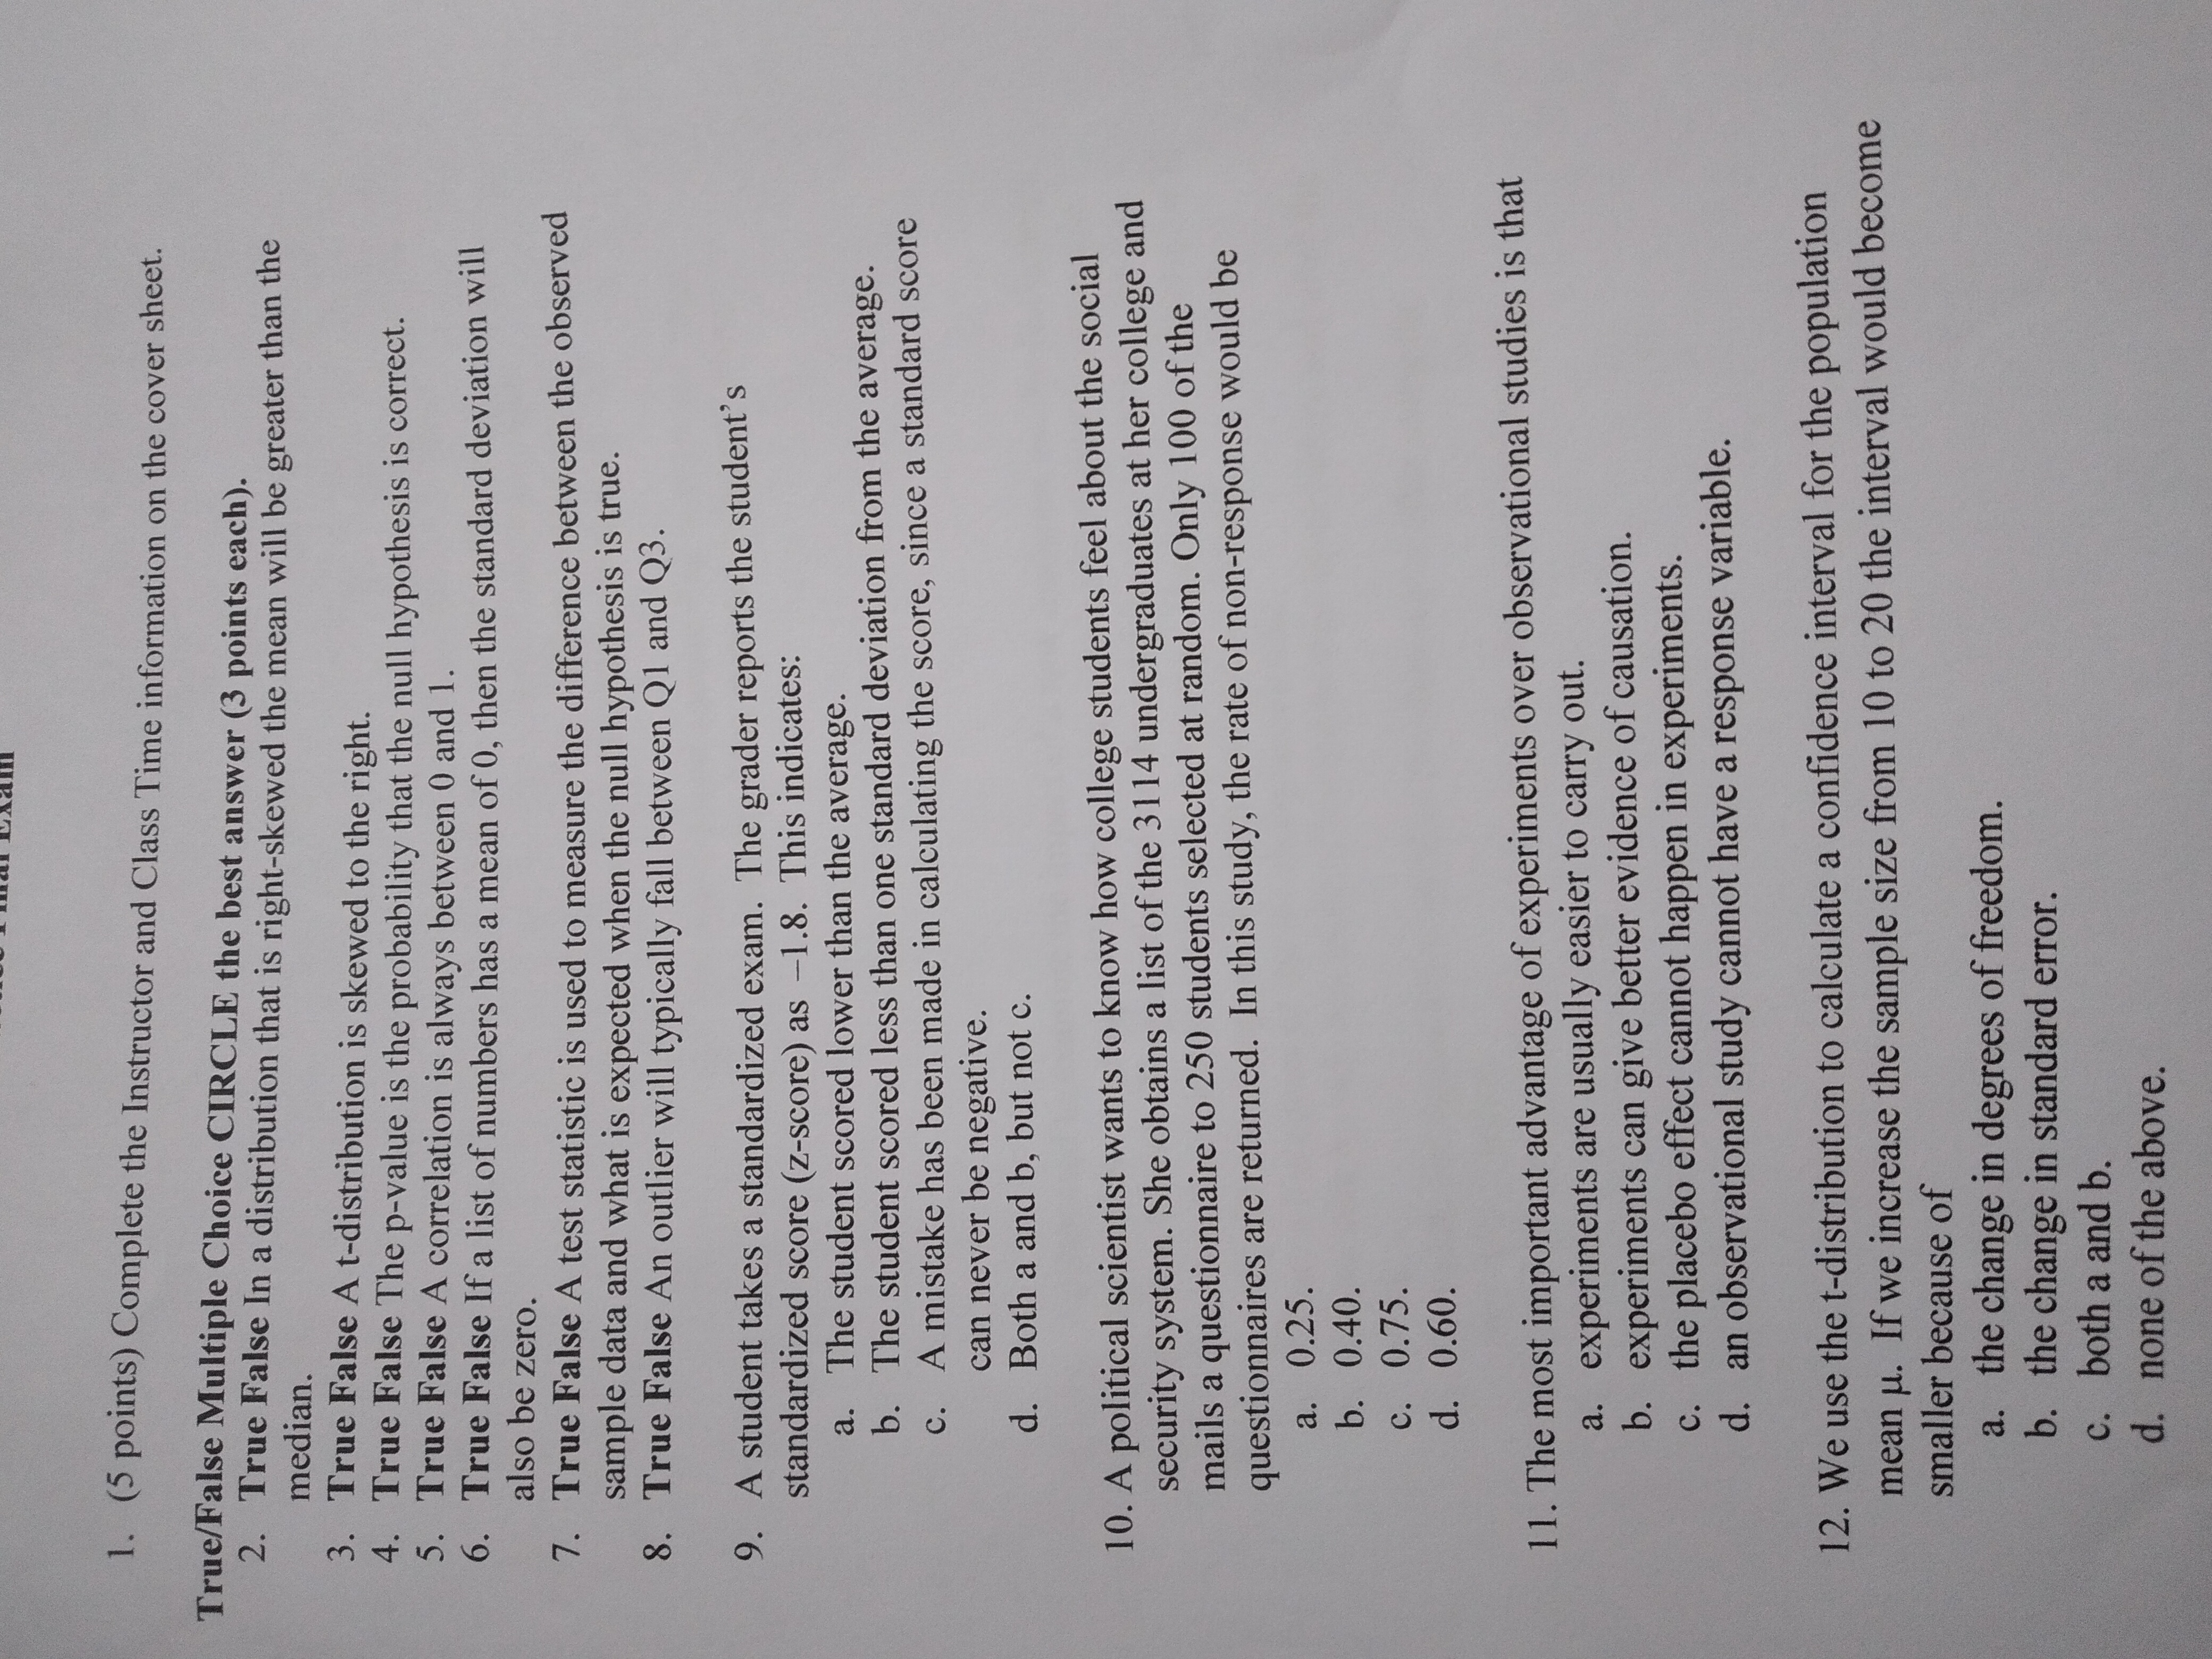
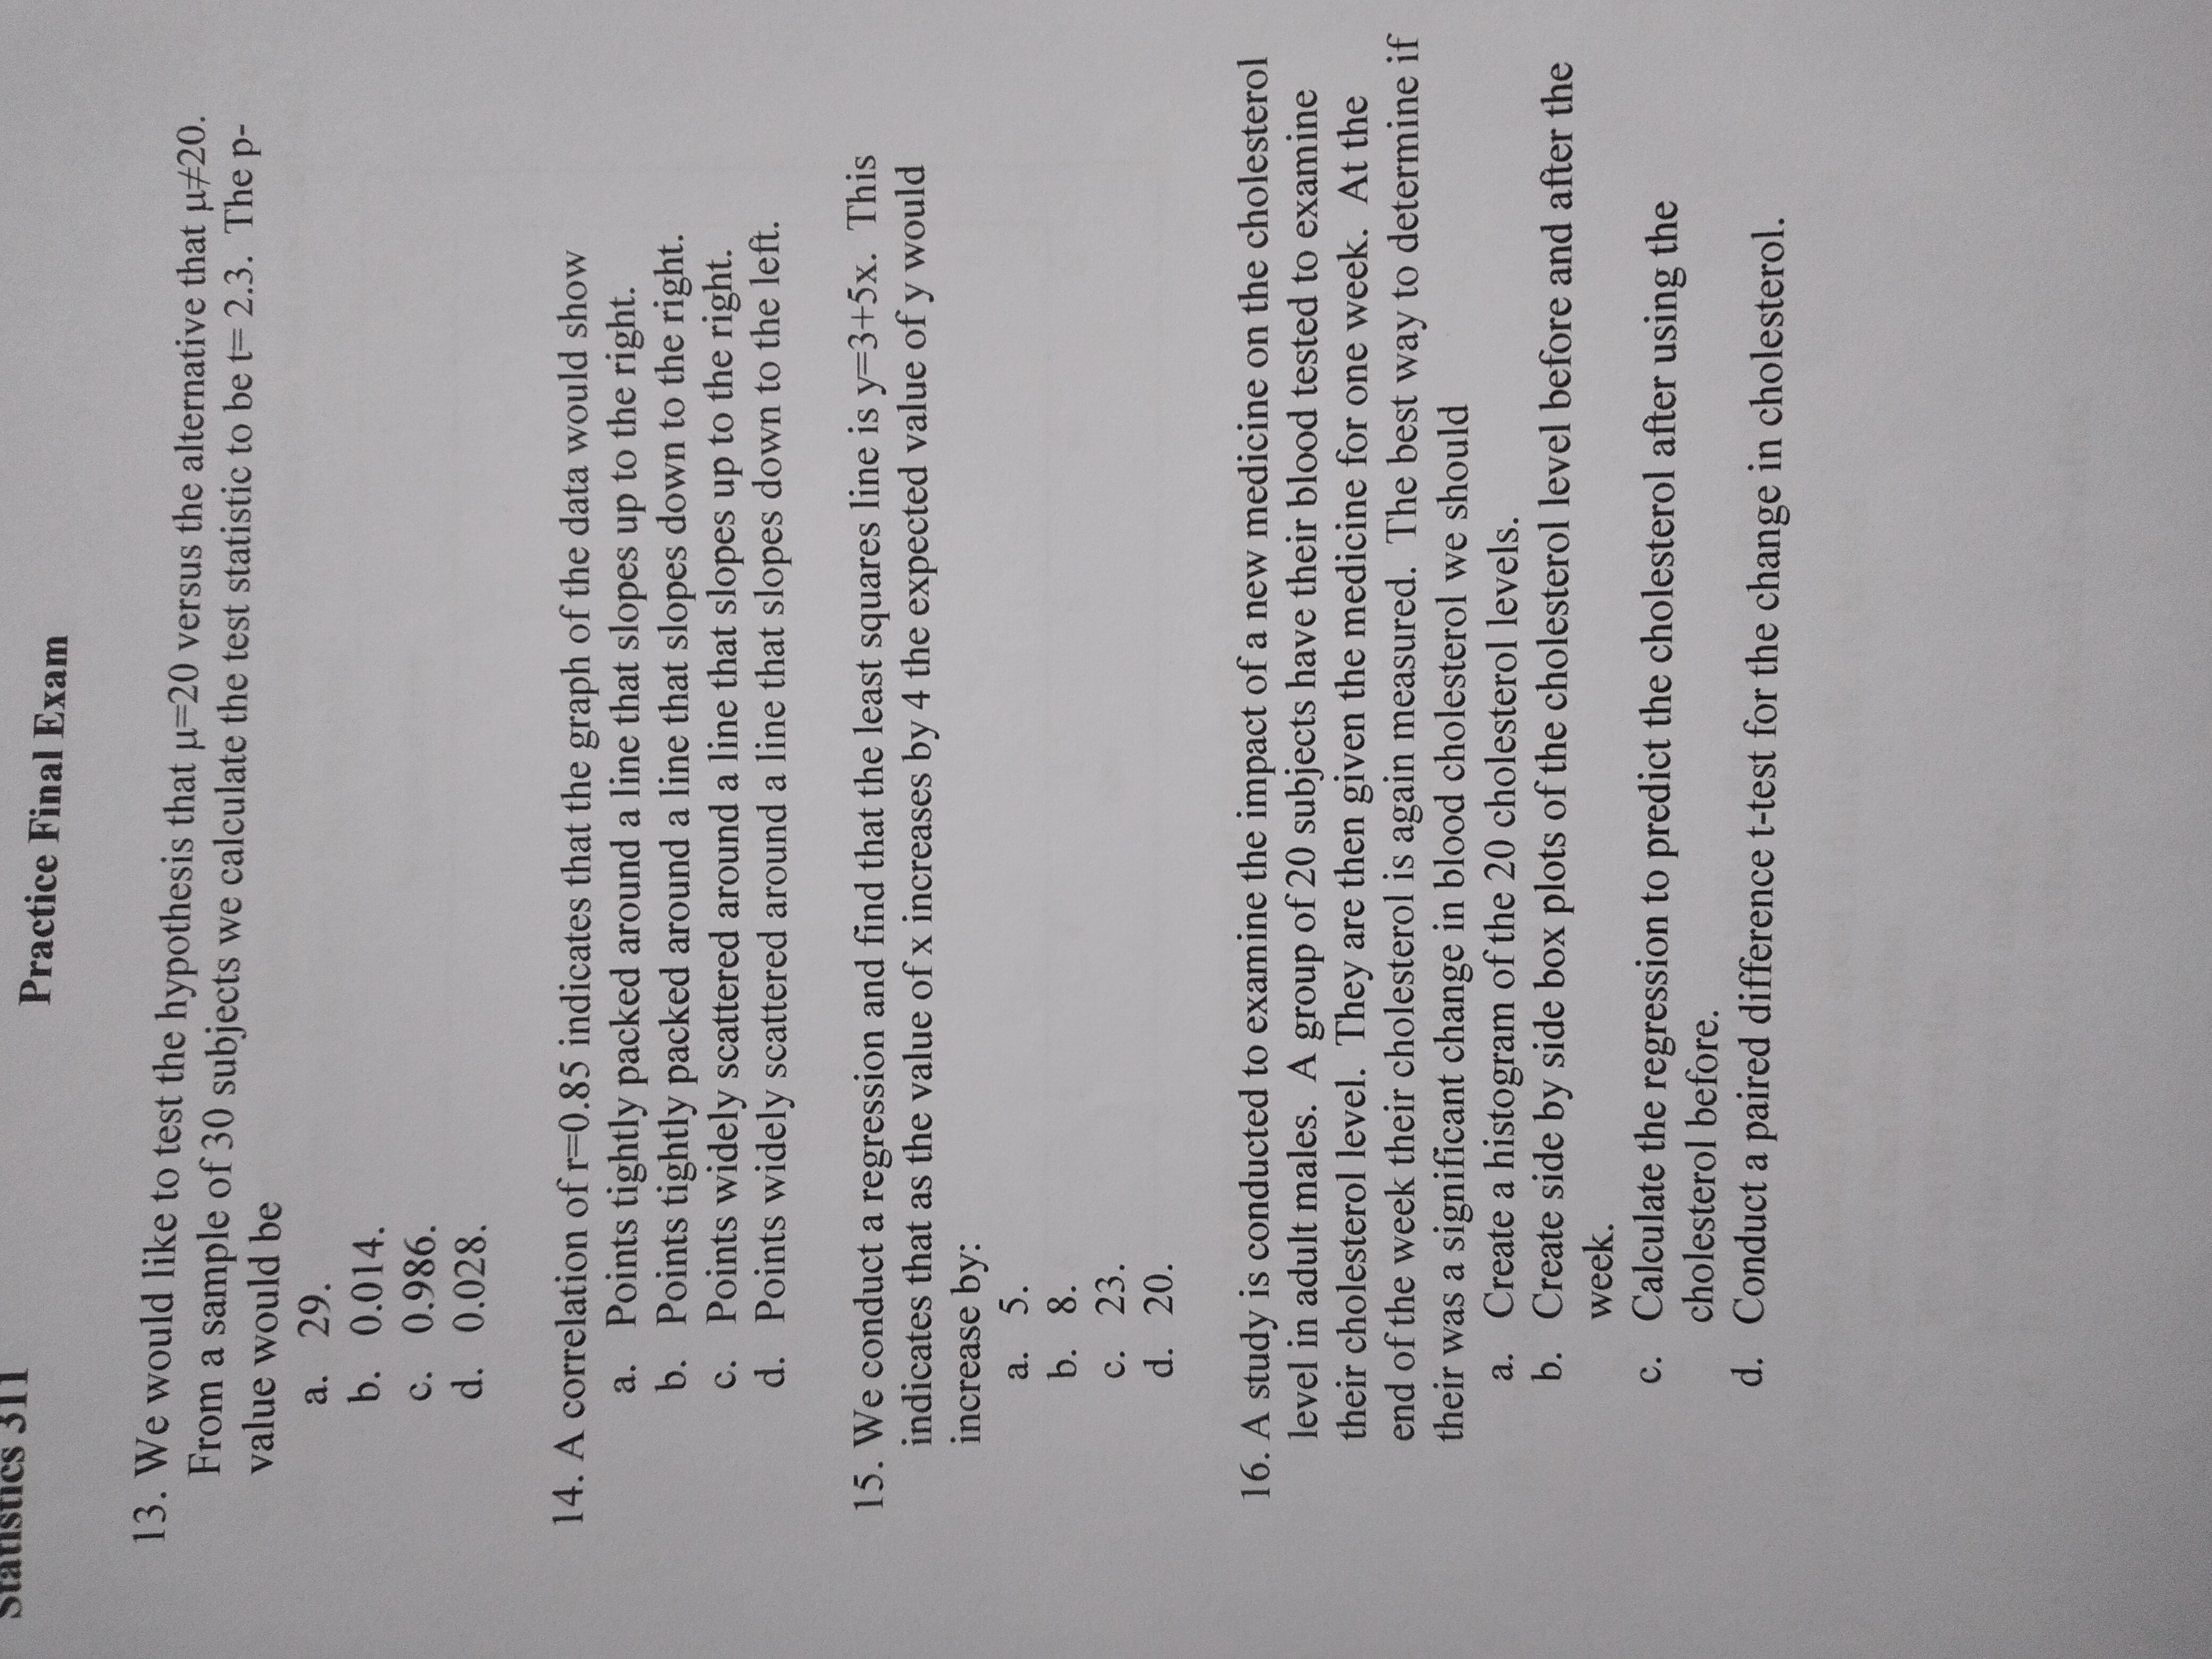
1. (5 points) Complete the Instructor and Class Time information on the cover sheet. True/False Multiple Choice CIRCLE the best answer (3 points each). 2. True False In a distribution that is right-skewed the mean will be greater than the median. 3 . True False A t-distribution is skewed to the right. 4. True False The p-value is the probability that the null hypothesis is correct. 5. True False A correlation is always between 0 and 1. 6. True False If a list of numbers has a mean of 0, then the standard deviation will also be zero. 7. True False A test statistic is used to measure the difference between the observed sample data and what is expected when the null hypothesis is true. 8. True False An outlier will typically fall between Q1 and Q3. 9. A student takes a standardized exam. The grader reports the student's standardized score (z-score) as -1.8. This indicates: a. The student scored lower than the average. b. The student scored less than one standard deviation from the average. c. A mistake has been made in calculating the score, since a standard score can never be negative. d. Both a and b, but not c. 10. A political scientist wants to know how college students feel about the social security system. She obtains a list of the 31 14 undergraduates at her college and mails a questionnaire to 250 students selected at random. Only 100 of the questionnaires are returned. In this study, the rate of non-response would be a. 0.25. b. 0.40. c. 0.75. d. 0.60. 1 1. The most important advantage of experiments over observational studies is that a. experiments are usually easier to carry out. b. experiments can give better evidence of causation. c. the placebo effect cannot happen in experiments. d. an observational study cannot have a response variable. 12. We use the t-distribution to calculate a confidence interval for the population mean u. If we increase the sample size from 10 to 20 the interval would become smaller because of a. the change in degrees of freedom. b. the change in standard error. c. both a and b. d. none of the above.Statistics 311 Practice Final Exam 13. We would like to test the hypothesis that u=20 versus the alternative that u#20. From a sample of 30 subjects we calculate the test statistic to be t= 2.3. The p- value would be a. 29. b. 0.014. C. 0.986. d. 0.028. 14. A correlation of r=0.85 indicates that the graph of the data would show a. Points tightly packed around a line that slopes up to the right. b. Points tightly packed around a line that slopes down to the right. c. Points widely scattered around a line that slopes up to the right. d. Points widely scattered around a line that slopes down to the left. 15. We conduct a regression and find that the least squares line is y=3+5x. This indicates that as the value of x increases by 4 the expected value of y would increase by: a. 5. b. 8. C. 23. d. 20. 16. A study is conducted to examine the impact of a new medicine on the cholesterol level in adult males. A group of 20 subjects have their blood tested to examine their cholesterol level. They are then given the medicine for one week. At the end of the week their cholesterol is again measured. The best way to determine if their was a significant change in blood cholesterol we should a. Create a histogram of the 20 cholesterol levels. b. Create side by side box plots of the cholesterol level before and after the week. c. Calculate the regression to predict the cholesterol after using the cholesterol before. d. Conduct a paired difference t-test for the change in cholesterol