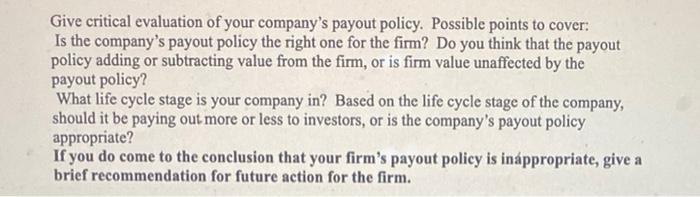
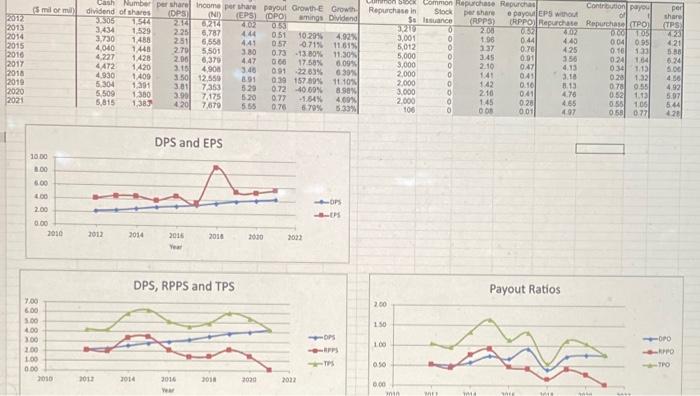
Give critical evaluation of your company's payout policy. Possible points to cover: Is the company's payout policy the right one for the firm? Do you think that the payout policy adding or subtracting value from the firm, or is firm value unaffected by the payout policy? What life cycle stage is your company in? Based on the life cycle stage of the company, should it be paying out more or less to investors, or is the company's payout policy appropriate? If you do come to the conclusion that your firm's payout policy is inappropriate, give a brief recommendation for future action for the firm. 2012 2013 2014 2015 2016 2017 2018 2019 2020 2021 (5 mil or mil) 10.00 8.00 6.00 2.00 0.00 7,00 6.00 5.00 4.00 3:00 2.00 1.00 0.00 2010 2010 Cash Number dividend of shares 3.305 1,544 3,434 1,529 3,730 1488 4,040 1448 4,227 1,428 4,472 1,420 4,930 1,409 5,304 1,391 5.509 1.300 5,815 1,383 2012 2012 2014 per share 2014 (DPS) (NI) 2.14 6,214 2.25 6,787 251 Income per share payout Growth-E Growth (EPS) (DPO) amings Dividend 0.53 0.51 0:57 6,558 2.70 5,501 2.00 6,379 3.15 4,908 3.50 12.559 3.01 7,353 3.90 7,175 420 7,679 DPS and EPS 2016 Year 2016 Year DPS, RPPS and TPS A 2018 4.44 4.41 3.80 4.47 3.46 8.91 5.29 5.20 0.77 5.55 0.76 2018 2020 2020 10.29% 071% 0.73 -13.80% 0:00 17.58% 091 -22.83% 0.39 157.89% 0.72 -40.60% -1.64% 6.79% 2022 2022 4.92% 11.61% 11.30% 6.09% 6.30% 11.10% 8.98% 4.09% 5.33% 4-OPS -8-IPS 4-OPS TPS in Stock Common Repurchase Repurchas Stock Repurchase in 8 8 8 2.00 1.50 1.00 0.00 Ss Issuance 3.210 3,001 5,012 5,000 3,000 2,000 2,000 3,000 2,000 2010 106 0 0 0 0 0 0 0 0 0 0 per share (RPPS) 2.08 1.96 3.37 3.45 2.10 1.41 1.42 2:16 1.45 0.08 Ma $ Contribution payou e payout EPS without (RPPO) Repurchase Repurchase (TPO) 0.00 1.05 0.32 0.44 THE 0.70 0.01 0.47 041 0.16 041 Payout Ratios 0.28 0.01 Mis 4.02 4.40 4:25 356 4.13 3.18 8.13 4.76 4.65 4.97 Ma of 0.04 0.95 0.16 133 0.24 1.64 034 1.13 0.28 1.32 0.78 0.55 0.52 1.13 0.55 1.06 058 077 per share (TPS) 4.23 421 5.88 6.24 5.00 4.50 4.92 5.97 5.44 4.28 -OPO -PO -TPO Give critical evaluation of your company's payout policy. Possible points to cover: Is the company's payout policy the right one for the firm? Do you think that the payout policy adding or subtracting value from the firm, or is firm value unaffected by the payout policy? What life cycle stage is your company in? Based on the life cycle stage of the company, should it be paying out more or less to investors, or is the company's payout policy appropriate? If you do come to the conclusion that your firm's payout policy is inappropriate, give a brief recommendation for future action for the firm. 2012 2013 2014 2015 2016 2017 2018 2019 2020 2021 (5 mil or mil) 10.00 8.00 6.00 2.00 0.00 7,00 6.00 5.00 4.00 3:00 2.00 1.00 0.00 2010 2010 Cash Number dividend of shares 3.305 1,544 3,434 1,529 3,730 1488 4,040 1448 4,227 1,428 4,472 1,420 4,930 1,409 5,304 1,391 5.509 1.300 5,815 1,383 2012 2012 2014 per share 2014 (DPS) (NI) 2.14 6,214 2.25 6,787 251 Income per share payout Growth-E Growth (EPS) (DPO) amings Dividend 0.53 0.51 0:57 6,558 2.70 5,501 2.00 6,379 3.15 4,908 3.50 12.559 3.01 7,353 3.90 7,175 420 7,679 DPS and EPS 2016 Year 2016 Year DPS, RPPS and TPS A 2018 4.44 4.41 3.80 4.47 3.46 8.91 5.29 5.20 0.77 5.55 0.76 2018 2020 2020 10.29% 071% 0.73 -13.80% 0:00 17.58% 091 -22.83% 0.39 157.89% 0.72 -40.60% -1.64% 6.79% 2022 2022 4.92% 11.61% 11.30% 6.09% 6.30% 11.10% 8.98% 4.09% 5.33% 4-OPS -8-IPS 4-OPS TPS in Stock Common Repurchase Repurchas Stock Repurchase in 8 8 8 2.00 1.50 1.00 0.00 Ss Issuance 3.210 3,001 5,012 5,000 3,000 2,000 2,000 3,000 2,000 2010 106 0 0 0 0 0 0 0 0 0 0 per share (RPPS) 2.08 1.96 3.37 3.45 2.10 1.41 1.42 2:16 1.45 0.08 Ma $ Contribution payou e payout EPS without (RPPO) Repurchase Repurchase (TPO) 0.00 1.05 0.32 0.44 THE 0.70 0.01 0.47 041 0.16 041 Payout Ratios 0.28 0.01 Mis 4.02 4.40 4:25 356 4.13 3.18 8.13 4.76 4.65 4.97 Ma of 0.04 0.95 0.16 133 0.24 1.64 034 1.13 0.28 1.32 0.78 0.55 0.52 1.13 0.55 1.06 058 077 per share (TPS) 4.23 421 5.88 6.24 5.00 4.50 4.92 5.97 5.44 4.28 -OPO -PO -TPO