

Question: One can zoom in toward a particular point in the domain of a function and see how the graph appears at different zoom levels.
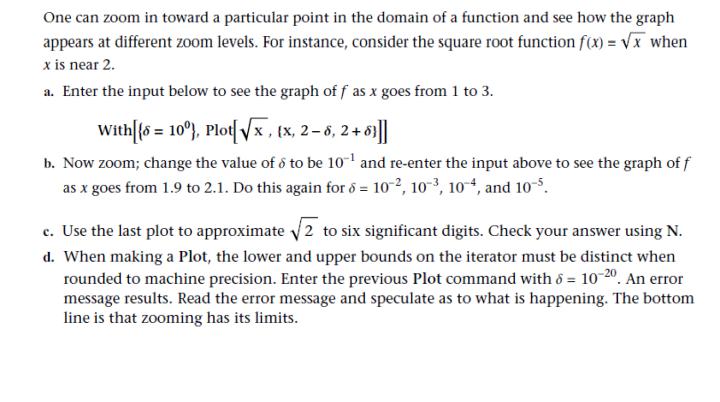
One can zoom in toward a particular point in the domain of a function and see how the graph appears at different zoom levels. For instance, consider the square root function f(x) = V when x is near 2. a. Enter the input below to see the graph of f as x goes from 1 to 3. with(6 = 10), Plot|Vx, (x, 2-6, 2+ 6|| b. Now zoom; change the value of to be 10 and re-enter the input above to see the graph of f as x goes from 1.9 to 2.1. Do this again for 8 = 102, 103, 104, and 10-5. c. Use the last plot to approximate v2 to six significant digits. Check your answer using N. d. When making a Plot, the lower and upper bounds on the iterator must be distinct when rounded to machine precision. Enter the previous Plot command with & = 10-20. An error message results. Read the error message and speculate as to what is happening. The bottom line is that zooming has its limits.
Step by Step Solution
3.42 Rating (161 Votes )
There are 3 Steps involved in it
Step 1 of 9 A a The objective of this question is to visualize the graph of the given functio... View full answer

Get step-by-step solutions from verified subject matter experts
Document Format (2 attachments)
6362ff31ae5b1_229268.pdf
180 KBs PDF File
6362ff31ae5b1_229268.docx
120 KBs Word File