GIVE TYPED WRITING SO I CAN UNDERSTAND CLEARLY.
Kindly give correct answers and step by step working.do not skip steps.Mention clearly about the formula and the conversion.be very clear.do not skip steps.be very clear.NUMBER THE Ans CLEARLY.
QMT110 OCTOBER 2009
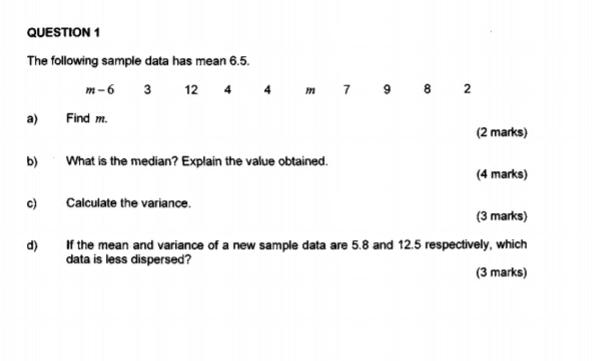
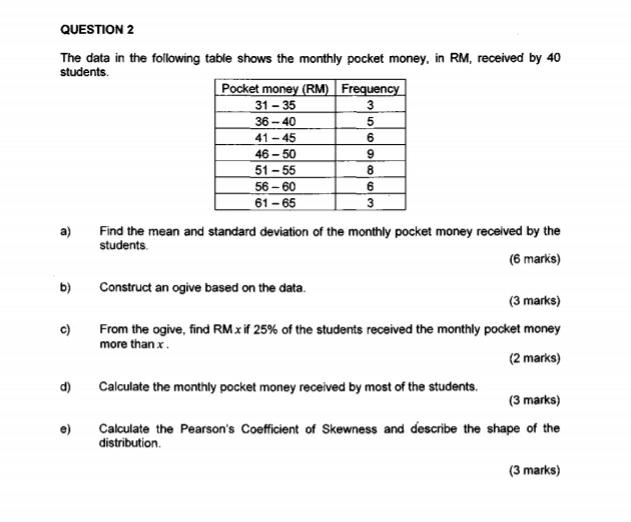
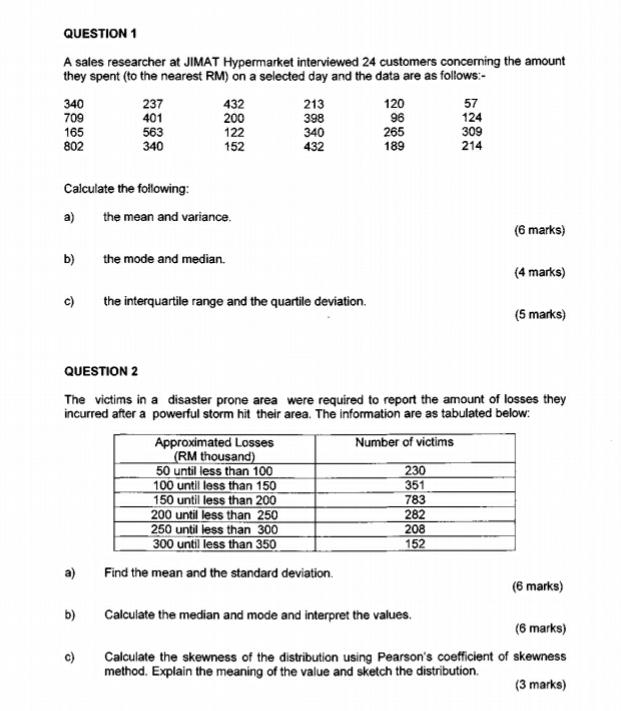
QUESTION 1 The following sample data has mean 6.5. m-6 3 12 7 9 8 2 a) Find m. (2 marks) b) What is the median? Explain the value obtained. (4 marks) c) Calculate the variance. (3 marks) d) If the mean and variance of a new sample data are 5.8 and 12.5 respectively, which data is less dispersed? (3 marks)QUESTION 2 The data in the following table shows the monthly pocket money, in RM, received by 40 students. Pocket money (RM) Frequency 31 - 35 3 36 -40 41 -45 6 46 -50 9 51 -55 8 56 -60 6 61 -65 a) Find the mean and standard deviation of the monthly pocket money received by the students. (6 marks) b) Construct an ogive based on the data. (3 marks) c) From the ogive, find RM x if 25% of the students received the monthly pocket money more than x . (2 marks) d) Calculate the monthly pocket money received by most of the students. (3 marks) e) Calculate the Pearson's Coefficient of Skewness and describe the shape of the distribution. (3 marks)QUESTION 1 A sales researcher at JIMAT Hypermarket interviewed 24 customers concerning the amount they spent (to the nearest RM) on a selected day and the data are as follows:- 340 237 432 213 120 57 709 401 200 398 96 124 165 563 122 340 265 309 802 340 152 432 189 214 Calculate the following: a) the mean and variance. (6 marks) b) the mode and median. (4 marks) c) the interquartile range and the quartile deviation. (5 marks) QUESTION 2 The victims in a disaster prone area were required to report the amount of losses they incurred after a powerful storm hit their area. The information are as tabulated below: Approximated Losses Number of victims (RM thousand) 50 until less than 100 230 100 until less than 150 351 150 until less than 200 783 200 until less than 250 282 250 until less than 300 208 300 until less than 350 152 a) Find the mean and the standard deviation. (6 marks) b) Calculate the median and mode and interpret the values. (6 marks) c) Calculate the skewness of the distribution using Pearson's coefficient of skewness method. Explain the meaning of the value and sketch the distribution