Answered step by step
Verified Expert Solution
Question
1 Approved Answer
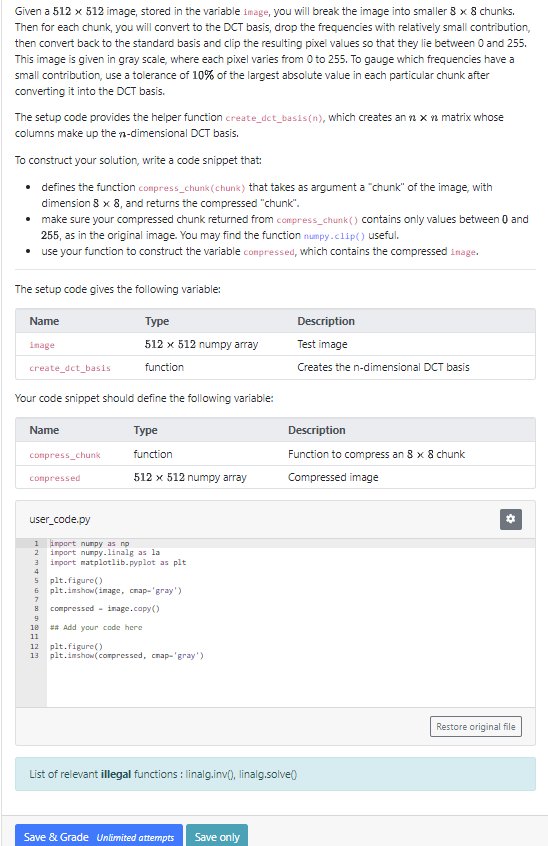
Given a 5 1 2 5 1 2 image, stored in the variable image, you will break the image into smaller 8 8 chunks. Then
Given a image, stored in the variable image, you will break the image into smaller chunks.
Then for each chunk, you will convert to the DCT basis, drop the frequencies with relatively small contribution,
then convert back to the standard basis and clip the resulting pixel values so that they lie between and
This image is given in gray scale, where each pixel varies from to To gauge which frequencies have a
small contribution, use a tolerance of of the largest absolute value in each particular chunk after
converting it into the DCT basis.
The setup code provides the helper function createdctbasisn which creates an matrix whose
columns make up the dimensional DCT basis.
To construct your solution, write a code snippet that:
defines the function compresschunkchunk that takes as argument a "chunk" of the image, with
dimension and returns the compressed "chunk".
make sure your compressed chunk returned from compresschunk contains only values between and
as in the original image. You may find the function numpy. clip useful.
use your function to construct the variable conpressed, which contains the compressed inage.
The setup code gives the following variable:
Your code snippet should define the following variable:
usercode.py
import numpy as np
import numpylinalg as la
import matplotlib.pyplot as plt
pltfigure
pltimshowimage cnap'gray'
compressed inage.
## Add your code here
pltfigure
pltimshowcorpressed cnap'gray'
List of relevant illegal functions : linalg.inv linalg.solve

Step by Step Solution
There are 3 Steps involved in it
Step: 1

Get Instant Access to Expert-Tailored Solutions
See step-by-step solutions with expert insights and AI powered tools for academic success
Step: 2

Step: 3

Ace Your Homework with AI
Get the answers you need in no time with our AI-driven, step-by-step assistance
Get Started


