Answered step by step
Verified Expert Solution
Question
1 Approved Answer
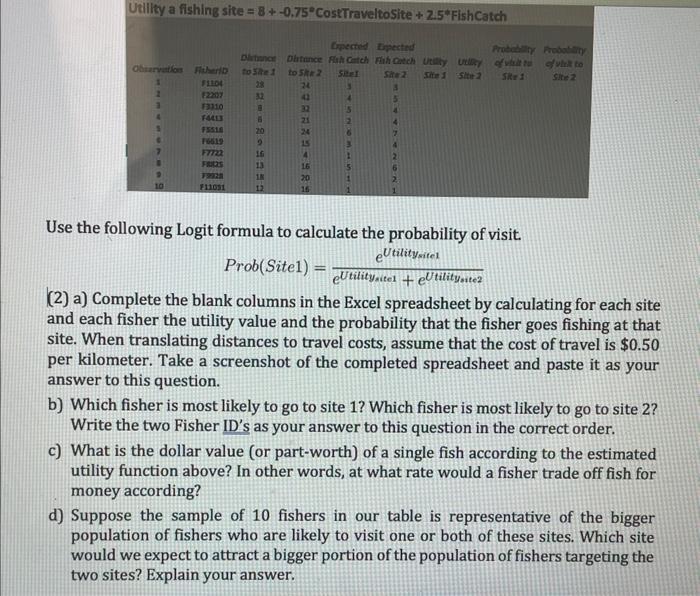
Utility a fishing site = 8+-0.75CostTraveltoSite + 2.5*Fish Catch Observation Fisheri 1 2 3 F1104 F2207 F3310 F4413 F5516 F6619 F7722 FRIEZS 79228 F11031

Utility a fishing site = 8+-0.75CostTraveltoSite + 2.5*Fish Catch Observation Fisheri 1 2 3 F1104 F2207 F3310 F4413 F5516 F6619 F7722 FRIEZS 79228 F11031 Expected Expected Distance Distance Fish Catch Fish Catch Utility Utility to Site 1 Site 1 Site 2 Site 2 3 5 4 AHINGTON 28 32 6 20 18 to Site 2 HURRAAIERH 24 43 32 21 24 15 20 15 Sitel 3 4 15 Probability Probability of visit to Site 1 of visit to Site 2 Use the following Logit formula to calculate the probability of visit. eUtilitysitel Prob(Sitel) = eUtility.itel + eUtilitysite? (2) a) Complete the blank columns in the Excel spreadsheet by calculating for each site and each fisher the utility value and the probability that the fisher goes fishing at that site. When translating distances to travel costs, assume that the cost of travel is $0.50 per kilometer. Take a screenshot of the completed spreadsheet and paste it as your answer to this question. b) Which fisher is most likely to go to site 1? Which fisher is most likely to go to site 2? Write the two Fisher ID's as your answer to this question in the correct order. c) What is the dollar value (or part-worth) of a single fish according to the estimated utility function above? In other words, at what rate would a fisher trade off fish for money according? d) Suppose the sample of 10 fishers in our table is representative of the bigger population of fishers who are likely to visit one or both of these sites. Which site would we expect to attract a bigger portion of the population of fishers targeting the two sites? Explain your answer.
Step by Step Solution
★★★★★
3.38 Rating (154 Votes )
There are 3 Steps involved in it
Step: 1
a Complete the blank columns in the Excel spreadsheet by calculating for each site and each fisher the utility value and the probability that the fish...
Get Instant Access to Expert-Tailored Solutions
See step-by-step solutions with expert insights and AI powered tools for academic success
Step: 2

Step: 3

Ace Your Homework with AI
Get the answers you need in no time with our AI-driven, step-by-step assistance
Get Started


