

Question
Given a sequence of points y1, . . . , yn, isotonic regression seeks to fit a piecewise linear non-decreasing function that is as close
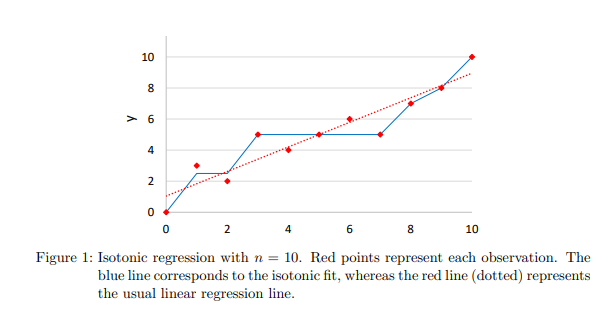
Given a sequence of points y1, . . . , yn, isotonic regression seeks to fit a piecewise linear non-decreasing function that is as close as possible to the observed points. Figure 1 illustrates the comparison of the isotonic regression curve (blue) and usual least squares line (dotted red line) with 10 points. Formulate the problem of obtained the best isotonic regression curve in the least squares sense (that is, finding the best non-decreasing curve that minimizes the sum of squared errors between predictions and observations yi) as an optimization problem.

Step by Step Solution
There are 3 Steps involved in it
Step: 1

Get Instant Access to Expert-Tailored Solutions
See step-by-step solutions with expert insights and AI powered tools for academic success
Step: 2

Step: 3
Ace Your Homework with AI
Get the answers you need in no time with our AI-driven, step-by-step assistance
Get Started
Entropy And Diversity The Axiomatic Approach
Authors: Tom Leinster
1st Edition
1108962173, 9781108962179