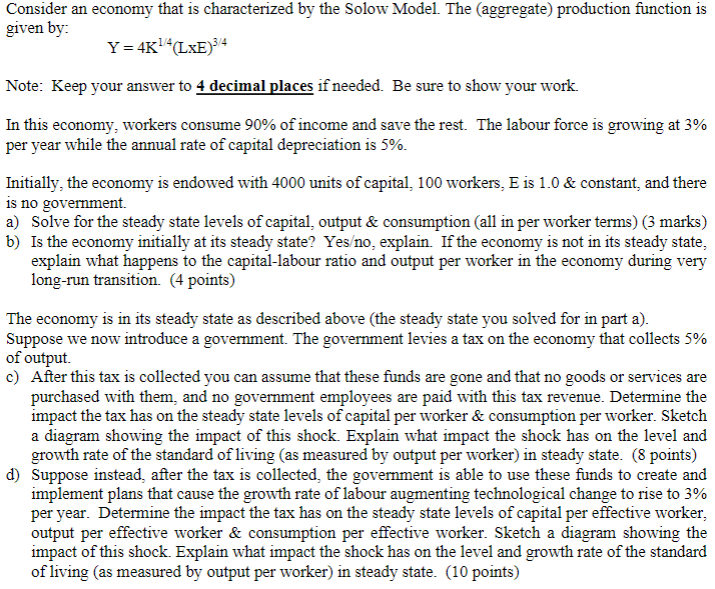
given by: Y=4K1/4(LxE)3/4 Note: Keep your answer to 4decimalplaces if needed. Be sure to show your work. In this economy, workers consume 90% of income and save the rest. The labour force is growing at 3% per year while the annual rate of capital depreciation is 5%. Initially, the economy is endowed with 4000 units of capital, 100 workers, E is 1.0 \& constant, and there is no government. a) Solve for the steady state levels of capital, output \& consumption (all in per worker terms) ( 3 marks) b) Is the economy initially at its steady state? Yeso, explain. If the economy is not in its steady state, explain what happens to the capital-labour ratio and output per worker in the economy during very long-run transition. (4 points) The economy is in its steady state as described above (the steady state you solved for in part a). Suppose we now introduce a government. The government levies a tax on the economy that collects 5% of output. c) After this tax is collected you can assume that these funds are gone and that no goods or services are purchased with them, and no government employees are paid with this tax revenue. Determine the impact the tax has on the steady state levels of capital per worker \& consumption per worker. Sketch a diagram showing the impact of this shock. Explain what impact the shock has on the level and growth rate of the standard of living (as measured by output per worker) in steady state. ( 8 points) d) Suppose instead, after the tax is collected, the government is able to use these funds to create and implement plans that cause the growth rate of labour augmenting technological change to rise to 3% per year. Determine the impact the tax has on the steady state levels of capital per effective worker, output per effective worker \& consumption per effective worker. Sketch a diagram showing the impact of this shock. Explain what impact the shock has on the level and growth rate of the standard of living (as measured by output per worker) in steady state. ( 10 points) given by: Y=4K1/4(LxE)3/4 Note: Keep your answer to 4decimalplaces if needed. Be sure to show your work. In this economy, workers consume 90% of income and save the rest. The labour force is growing at 3% per year while the annual rate of capital depreciation is 5%. Initially, the economy is endowed with 4000 units of capital, 100 workers, E is 1.0 \& constant, and there is no government. a) Solve for the steady state levels of capital, output \& consumption (all in per worker terms) ( 3 marks) b) Is the economy initially at its steady state? Yeso, explain. If the economy is not in its steady state, explain what happens to the capital-labour ratio and output per worker in the economy during very long-run transition. (4 points) The economy is in its steady state as described above (the steady state you solved for in part a). Suppose we now introduce a government. The government levies a tax on the economy that collects 5% of output. c) After this tax is collected you can assume that these funds are gone and that no goods or services are purchased with them, and no government employees are paid with this tax revenue. Determine the impact the tax has on the steady state levels of capital per worker \& consumption per worker. Sketch a diagram showing the impact of this shock. Explain what impact the shock has on the level and growth rate of the standard of living (as measured by output per worker) in steady state. ( 8 points) d) Suppose instead, after the tax is collected, the government is able to use these funds to create and implement plans that cause the growth rate of labour augmenting technological change to rise to 3% per year. Determine the impact the tax has on the steady state levels of capital per effective worker, output per effective worker \& consumption per effective worker. Sketch a diagram showing the impact of this shock. Explain what impact the shock has on the level and growth rate of the standard of living (as measured by output per worker) in steady state. ( 10 points)


