

Answered step by step
Verified Expert Solution
Question
1 Approved Answer
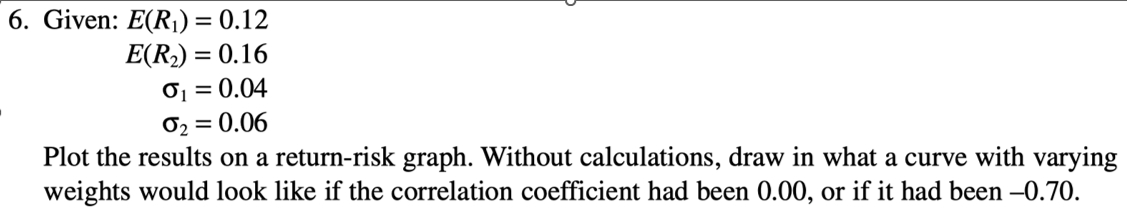
Given: E ( R 1 ) = 0 . 1 2 E ( R 2 ) = 0 . 1 6 1 = 0 .
Given:
Plot the results on a returnrisk graph. Without calculations, draw in what a curve with varying
weights would look like if the correlation coefficient had been or if it had been
Step by Step Solution
There are 3 Steps involved in it
Step: 1

Get Instant Access to Expert-Tailored Solutions
See step-by-step solutions with expert insights and AI powered tools for academic success
Step: 2

Step: 3
Ace Your Homework with AI
Get the answers you need in no time with our AI-driven, step-by-step assistance
Get Started
Real Life Money An Honest Guide To Taking Control Of Your Finances
Authors: Clare Seal
1st Edition
1472272293, 978-1472272294