

Answered step by step
Verified Expert Solution
Question
1 Approved Answer
Given the Activity on Arrow Diagram and the data found in the table above, calculate each of the following values: Activity A ( t_{e}=27 )

 Given the Activity on Arrow Diagram and the data found in the table above, calculate each of the following values: Activity A \( t_{e}=27 \) Standard Deviation \( =3 \) Activity \( B \ldots \ldots .
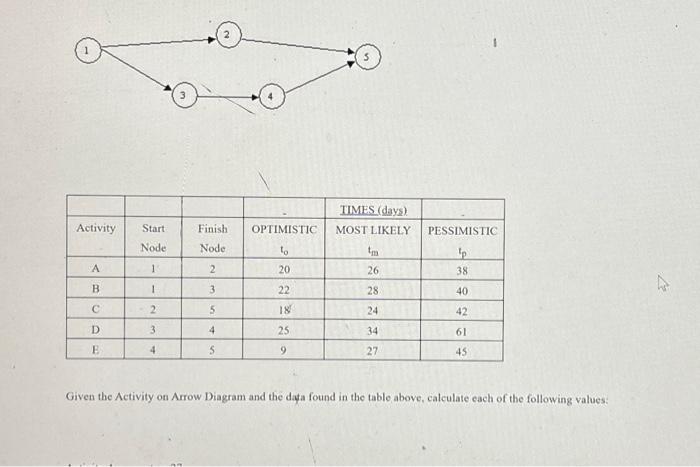

Step by Step Solution
There are 3 Steps involved in it
Step: 1

Get Instant Access to Expert-Tailored Solutions
See step-by-step solutions with expert insights and AI powered tools for academic success
Step: 2

Step: 3
Ace Your Homework with AI
Get the answers you need in no time with our AI-driven, step-by-step assistance
Get Started
Enterprise
Authors: William B. Gartner; Marlene G. Bellamy
1st edition
978-0324130850, 324130856, 978-0324786552