Given the assigned stock (AMGN) to you, please upload the Excel file (Yourlastname_Ticker.xls) that shows the process of finding the beta for the stock. The file should contain only ONE sheet or tab. On Yahoo!Finance, select "Duration" and "Frequency": Most recent 5-year monthly prices. Then click "Apply" before "Download" into a .csv file. Copy data to Excel to do the Regression analysis (under "Data", then "Data Analysis").
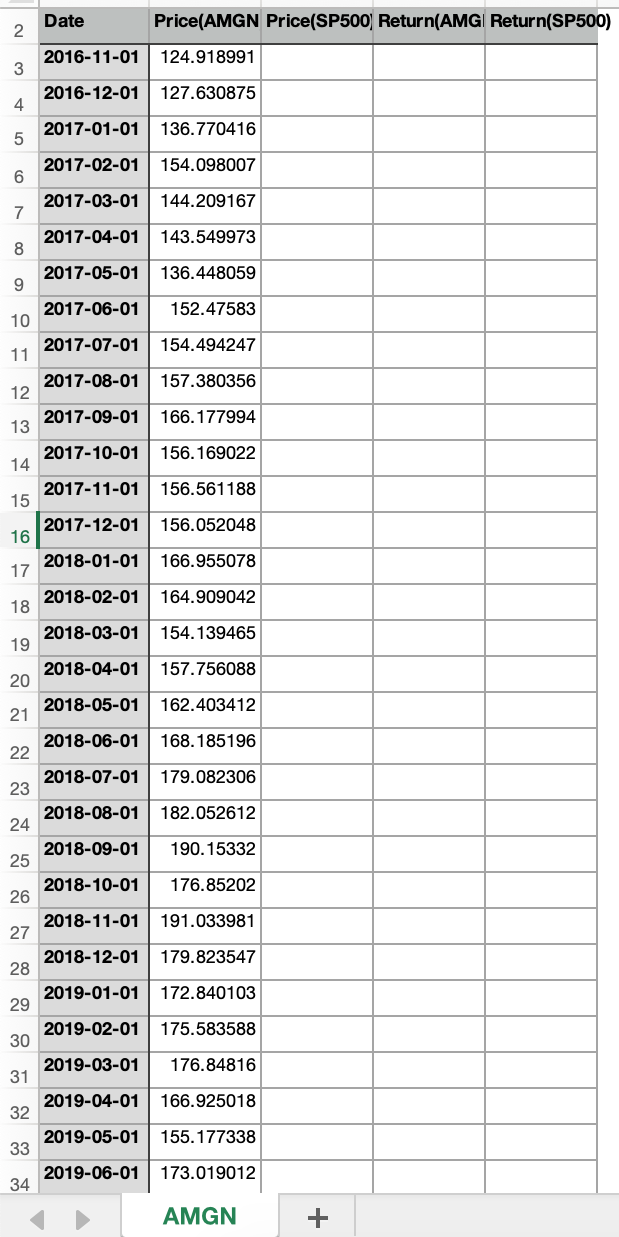
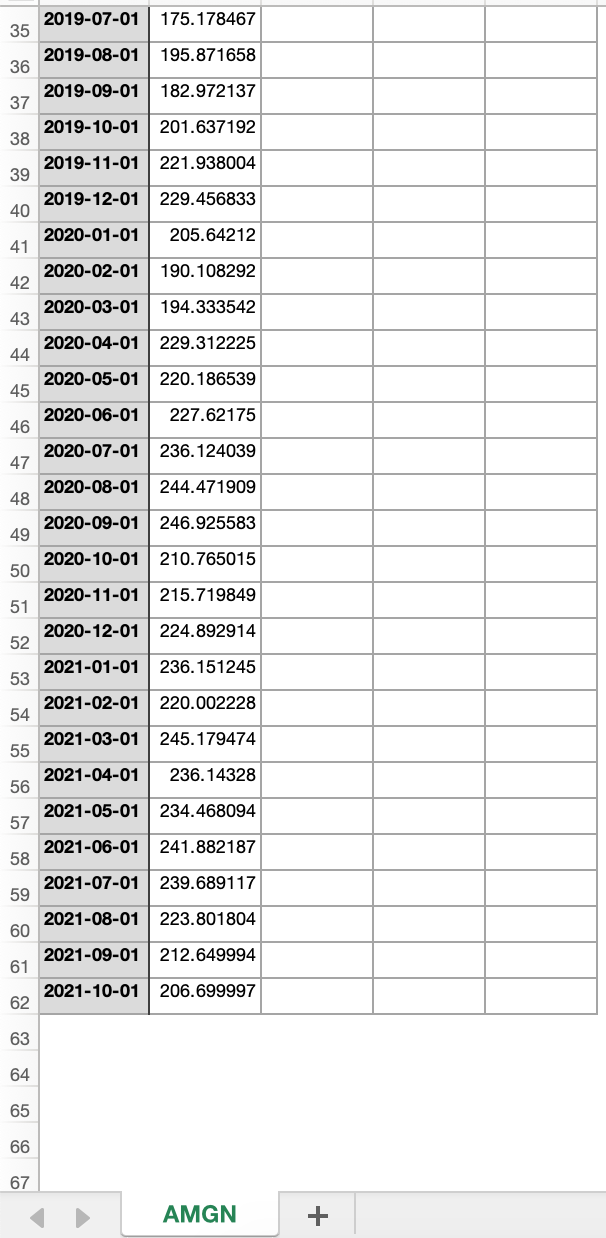
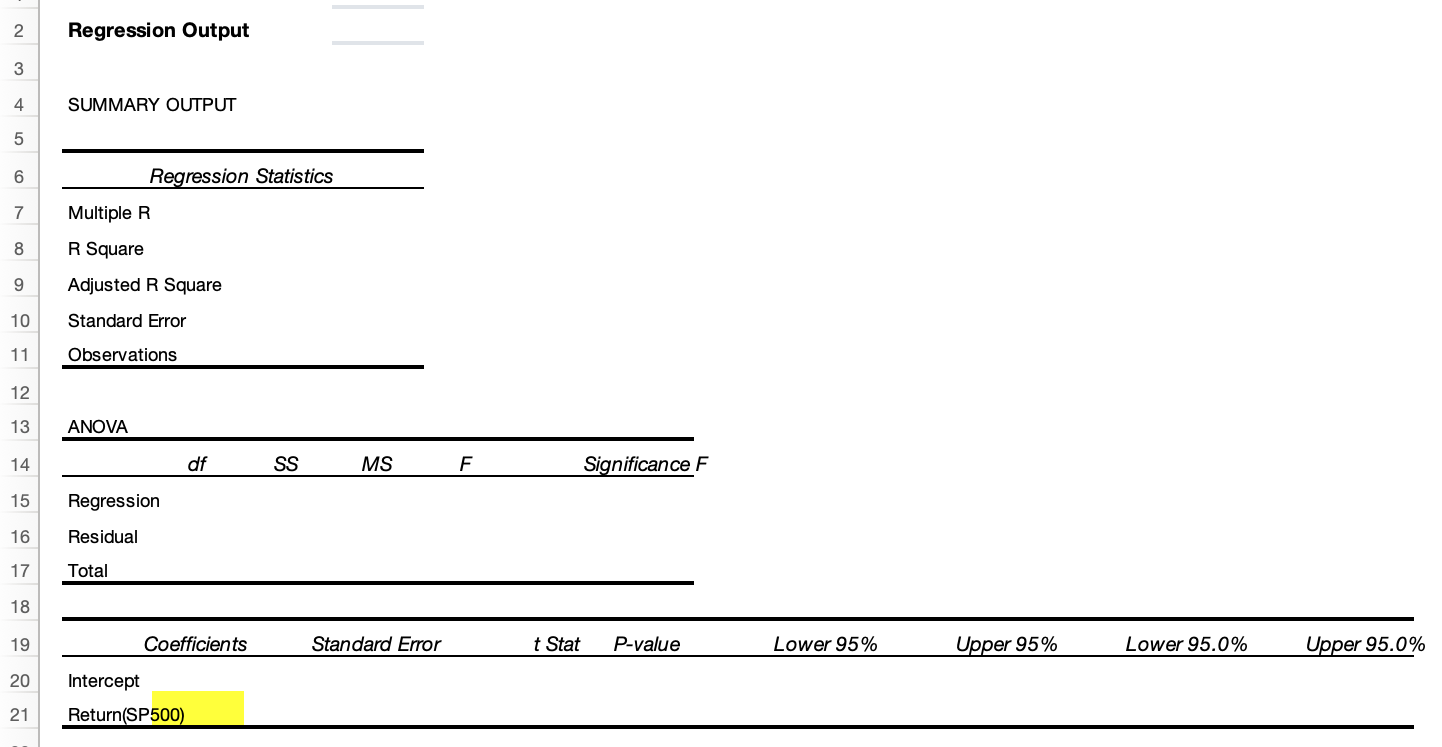
Date Price(AMGN Price(SP500) Return(AMGI Return(SP500) 2 2016-11-01 124.918991 3 2016-12-01 127.630875 4. 2017-01-01 136.770416 5 2017-02-01 154.098007 6 2017-03-01 144.209167 7 2017-04-01 143.549973 8 2017-05-01 136.448059 9 2017-06-01 152.47583 10 2017-07-01 154.494247 11 2017-08-01 157.380356 12 2017-09-01 166.177994 13 2017-10-01 156.169022 14 2017-11-01 156.561188 15 2017-12-01 156.052048 16 2018-01-01 166.955078 17 2018-02-01 164.909042 18 2018-03-01 154.139465 19 2018-04-01 157.756088 20 2018-05-01 162.403412 21 2018-06-01 168.185196 22 2018-07-01 179.082306 23 2018-08-01 182.052612 24 2018-09-01 190.15332 25 2018-10-01 176.85202 26 2018-11-01 191.033981 27 2018-12-01 179.823547 28 2019-01-01 172.840103 29 2019-02-01 175.583588 30 2019-03-01 176.84816 31 2019-04-01 166.925018 32 2019-05-01 155. 177338 33 2019-06-01 173.019012 34 AMGN + 2019-07-01 175.178467 35 2019-08-01 195.871658 36 2019-09-01 182.972137 37 2019-10-01 201.637192 38 2019-11-01 221.938004 39 2019-12-01 229.456833 40 2020-01-01 205.64212 41 2020-02-01 190.108292 42 2020-03-01 194.333542 43 2020-04-01 229.312225 44 2020-05-01 220.186539 45 2020-06-01 227.62175 46 2020-07-01 236.124039 47 2020-08-01 244.471909 48 2020-09-01 246.925583 49 2020-10-01 | 210.765015 50 2020-11-01 | 215.719849 51 2020-12-01 224.892914 52 2021-01-01 236.151245 53 2021-02-01 220.002228 54 2021-03-01 245.179474 55 2021-04-01 236.14328 56 2021-05-01 234.468094 57 2021-06-01 241.882187 58 2021-07-01 239.689117 59 2021-08-01 223.801804 60 2021-09-01 212.649994 61 2021-10-01 206.699997 62 63 64 65 66 67 AMGN 2 Regression Output 3 4 SUMMARY OUTPUT 5 6 Regression Statistics Multiple R 7 8 R Square 9 Adjusted R Square 10 Standard Error 11 Observations 12 13 ANOVA 14 df SS MS F Significance F 15 Regression 16 Residual 17 Total 18 19 Coefficients Standard Error t Stat P-value Lower 95% Upper 95% Lower 95.0% Upper 95.0% 20 Intercept Return(SP500) 21 Date Price(AMGN Price(SP500) Return(AMGI Return(SP500) 2 2016-11-01 124.918991 3 2016-12-01 127.630875 4. 2017-01-01 136.770416 5 2017-02-01 154.098007 6 2017-03-01 144.209167 7 2017-04-01 143.549973 8 2017-05-01 136.448059 9 2017-06-01 152.47583 10 2017-07-01 154.494247 11 2017-08-01 157.380356 12 2017-09-01 166.177994 13 2017-10-01 156.169022 14 2017-11-01 156.561188 15 2017-12-01 156.052048 16 2018-01-01 166.955078 17 2018-02-01 164.909042 18 2018-03-01 154.139465 19 2018-04-01 157.756088 20 2018-05-01 162.403412 21 2018-06-01 168.185196 22 2018-07-01 179.082306 23 2018-08-01 182.052612 24 2018-09-01 190.15332 25 2018-10-01 176.85202 26 2018-11-01 191.033981 27 2018-12-01 179.823547 28 2019-01-01 172.840103 29 2019-02-01 175.583588 30 2019-03-01 176.84816 31 2019-04-01 166.925018 32 2019-05-01 155. 177338 33 2019-06-01 173.019012 34 AMGN + 2019-07-01 175.178467 35 2019-08-01 195.871658 36 2019-09-01 182.972137 37 2019-10-01 201.637192 38 2019-11-01 221.938004 39 2019-12-01 229.456833 40 2020-01-01 205.64212 41 2020-02-01 190.108292 42 2020-03-01 194.333542 43 2020-04-01 229.312225 44 2020-05-01 220.186539 45 2020-06-01 227.62175 46 2020-07-01 236.124039 47 2020-08-01 244.471909 48 2020-09-01 246.925583 49 2020-10-01 | 210.765015 50 2020-11-01 | 215.719849 51 2020-12-01 224.892914 52 2021-01-01 236.151245 53 2021-02-01 220.002228 54 2021-03-01 245.179474 55 2021-04-01 236.14328 56 2021-05-01 234.468094 57 2021-06-01 241.882187 58 2021-07-01 239.689117 59 2021-08-01 223.801804 60 2021-09-01 212.649994 61 2021-10-01 206.699997 62 63 64 65 66 67 AMGN 2 Regression Output 3 4 SUMMARY OUTPUT 5 6 Regression Statistics Multiple R 7 8 R Square 9 Adjusted R Square 10 Standard Error 11 Observations 12 13 ANOVA 14 df SS MS F Significance F 15 Regression 16 Residual 17 Total 18 19 Coefficients Standard Error t Stat P-value Lower 95% Upper 95% Lower 95.0% Upper 95.0% 20 Intercept Return(SP500) 21