

Answered step by step
Verified Expert Solution
Question
1 Approved Answer
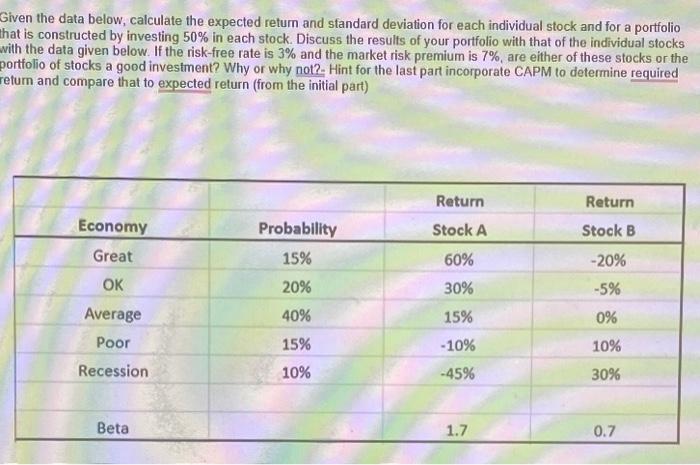
Given the data below, calculate the expected return and standard deviation for each individual stock and for a portfolio that is constructed by investing 50%
Step by Step Solution
There are 3 Steps involved in it
Step: 1

Get Instant Access to Expert-Tailored Solutions
See step-by-step solutions with expert insights and AI powered tools for academic success
Step: 2

Step: 3
Ace Your Homework with AI
Get the answers you need in no time with our AI-driven, step-by-step assistance
Get Started
Housing Policy And Finance
Authors: John Black, David Stafford
1st Edition
0415004195, 978-0415004190