Answered step by step
Verified Expert Solution
Question
1 Approved Answer
Given the data on bond prices, coupon rates, and maturities below, use regression analysis to estimate the yield curve. Recognize that the dependent variable in
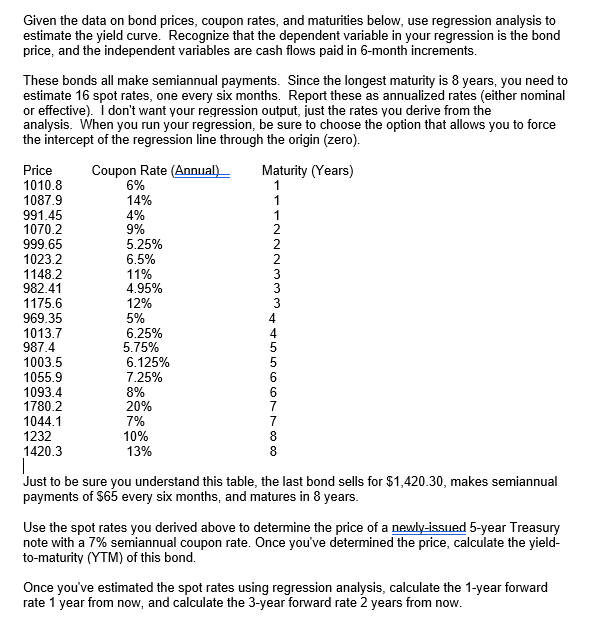
Given the data on bond prices, coupon rates, and maturities below, use regression analysis to estimate the yield curve. Recognize that the dependent variable in your regression is the bond price, and the independent variables are cash flows paid in 6 -month increments. These bonds all make semiannual payments. Since the longest maturity is 8 years, you need to estimate 16 spot rates, one every six months. Report these as annualized rates (either nominal or effective). I don't want your regression output, just the rates you derive from the analysis. When you run your regression, be sure to choose the option that allows you to force the intercept of the regression line through the origin (zero). 'Just to be sure you understand this table, the last bond sells for $1,420.30, makes semiannual payments of $65 every six months, and matures in 8 years. Use the spot rates you derived above to determine the price of a newly-issued 5-year Treasury note with a 7% semiannual coupon rate. Once you've determined the price, calculate the yieldto-maturity (YTM) of this bond. Once you've estimated the spot rates using regression analysis, calculate the 1-year forward rate 1 year from now, and calculate the 3 -year forward rate 2 years from now
Step by Step Solution
There are 3 Steps involved in it
Step: 1
Get Instant Access to Expert-Tailored Solutions
See step-by-step solutions with expert insights and AI powered tools for academic success
Step: 2
Step: 3
Ace Your Homework with AI
Get the answers you need in no time with our AI-driven, step-by-step assistance
Get Started