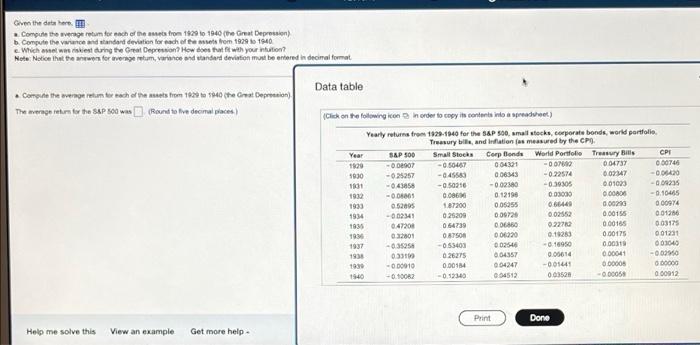
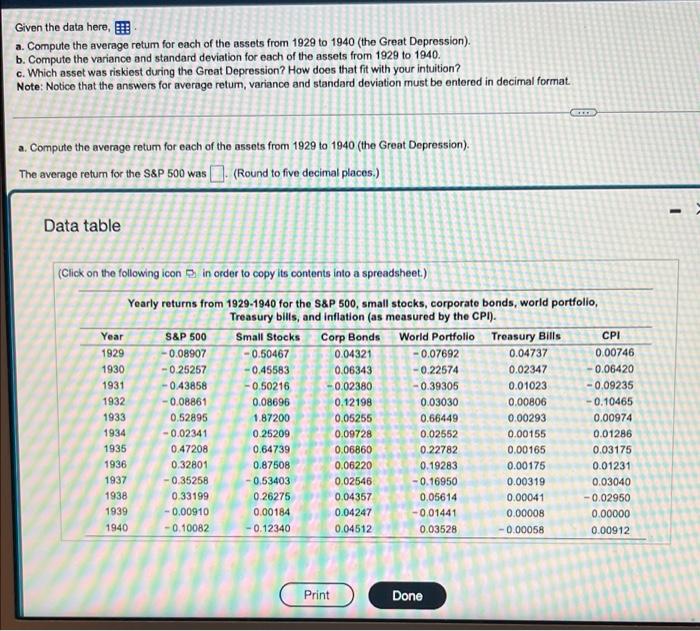
Given the deather Compute the verge return for anche themes from 1929 to 1940 (the Great Depression) b. Compute the wind andard deviation for each of these from 1929 1940 Which we miestoring the real Depression How does that it with your nation? HoteNotion that the news for vengetum,vance and standard deviction most be entered in decimal format Data table . Compute the averagem ter nach or the meets from 1928 940 (the Great Depression) The were en tur the SAP sowan Rand to live decimal pace (Click on the following con In order to copy its content in a spreadt) Yearly returns from 1929-1940 for the S&P 500 small tecks, corporate bonds, world portfolio Treasury bills, and nation is measured by the CPO Year S&P 500 Small Stock Corp Blonde World Portfolio Treasury Bills CPI 1820 - D007 -0.50467 064321 - 004737 000746 1930 -0.25257 -0.45583 006343 -0.22574 0.02347 -0.06420 1901 -0.43858 -0.50316 -0.02380 -0.30305 0.01003 - 009235 1932 - 16 0.006 012190 003000 0.00806 -0.10405 1933 052005 1.87200 005355 666449 0.00203 00974 1934 -002341 025200 009726 0.02552 0.00155 001286 1935 0.47200 0.54739 006850 022710 0.00165 003175 1930 2001 010 04020 0.10200 0.00175 001231 1937 -35256 - 055403 002546 -0.16950 0.00318 03040 1938 03310 026275 004357 0.00614 000041 -0.000 1930 - 000010 0.001M 004247 -00141 0 0000 000000 1540 -0.10082 -0.140 004512 0.000 -0.00058 0 00912 Print Done Help me solve this View an example Get more help Given the data here, a. Compute the average retum for each of the assets from 1929 to 1940 (the Great Depression). b. Compute the variance and standard deviation for each of the assets from 1929 to 1940. c. Which asset was riskiest during the Great Depression? How does that fit with your intuition? Note: Notice that the answers for average retum, variance and standard deviation must be entered in decimal format. a. Compute the average retum for each of the assets from 1929 to 1940 (the Great Depression). The average return for the S&P 500 was - (Round to five decimal places.) - Data table (Click on the following icon in order to copy its contents into a spreadsheet.) Yearly returns from 1929-1940 for the S&P 500, small stocks, corporate bonds, world portfolio, Treasury bills, and inflation (as measured by the CPI). Year S&P 500 Small Stocks Corp Bonds World Portfolio Treasury Bills CPI 1929 -0.08907 -0.50467 0.04321 -0.07692 0.04737 0.00746 1930 -0.25257 -0.45583 0.06343 -0.22574 0.02347 0.06420 1931 043858 -0.50216 -0.02380 -0.39305 0.01023 -0.09235 1932 -0.08861 0.08696 0.12198 0.03030 0.00806 -0.10465 1933 0.52895 1.87200 0.05255 0.66449 0.00293 0.00974 1934 -0.02341 0.25209 0.09728 0.02552 0.00155 0.01286 1935 0.47208 0.64739 0.06860 0.22782 0.00165 0.03175 1936 0.32801 0.87508 0.06220 0.19283 0.00175 0.01231 1937 -0.35258 -0.53403 0.02546 -0.16950 0.00319 0.03040 1938 033199 0.26275 0.04357 0.05614 0.00041 -0.02950 1939 -0.00910 0.00184 0.04247 -0.01441 0.00008 0.00000 1940 -0.10082 0.12340 0.04512 0.03528 -0.00058 0.00912 Print Done


